Company: Axles India Limited
CIN: U27209TN1981PLC008630
ISIN: INE701C01011
Face Value: ₹10 per share
Shares Outstanding: ~2.55 Crore
Status: Active Unlisted Public Company
Industry: Auto Components / Commercial Vehicle Axles
Headquarters: Chennai, Tamil Nadu
Manufacturing Locations: Sriperumbudur, Cheyyar & Jamshedpur
Parent / Promoter Group: TSF Investments Limited / TSF Group
Latest Financial Year: FY2025-26
Official Website: Axles India Limited
Official Annual Reports: Axles India – Annual Reports
Executive Summary
Axles India Limited is a long-established Indian auto-component manufacturer specialising in axle housings and axle-related components for light, medium and heavy commercial vehicles and buses.
The company was established in 1982 as a joint venture with Eaton. In 1998, Dana acquired Eaton’s axle business and Dana’s stake in Axles India subsequently became part of that transaction. In 2025, the TSF Group acquired Dana’s entire stake, materially changing the ownership structure.
Today, Axles India is a joint venture/subsidiary within the TSF ecosystem and has manufacturing facilities in:
- Sriperumbudur, Tamil Nadu
- Cheyyar, Tamil Nadu
- Jamshedpur, Jharkhand
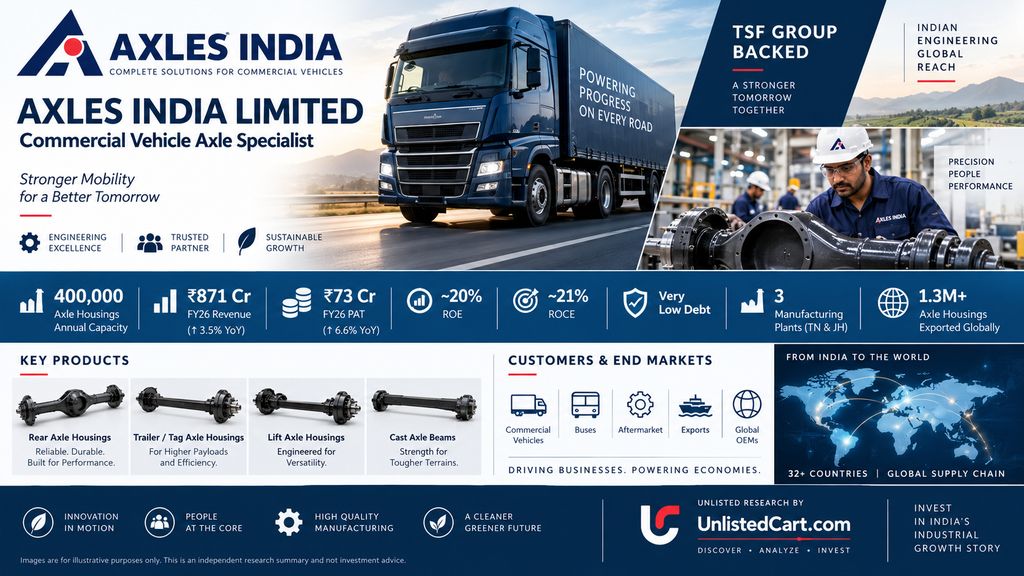
The company’s official website states an annual axle-housing capacity of approximately 4,00,000 units across these facilities.
FY2026 Financial Highlights
- Revenue from operations: ₹871.19 Cr
- Total income: ₹887.85 Cr
- PBT: ₹96.58 Cr
- PAT: ₹73.24 Cr
- EBITDA: approximately ₹110.70 Cr
- EBITDA margin: approximately 12.7%
- Net worth: approximately ₹369.49 Cr
- Total debt: approximately ₹2.86 Cr
- ROE: approximately 19.8%
- ROCE: approximately 21.3%
The company therefore combines healthy profitability, low leverage and strong return ratios.
At current indicative unlisted prices ranging roughly from ₹495 to ₹585/share, valuation varies considerably between intermediaries. This corresponds to approximately 17–20x FY2026 earnings, depending on the transaction reference used.
Company Background
Axles India was established in 1982 with Eaton.
Its initial production was focused on supplying axle housings to Ashok Leyland. The company subsequently expanded its manufacturing footprint as commercial-vehicle demand increased.
In 1995, Axles India established its Cheyyar facility.
In 2003, it installed a facility for Drive Head assemblies.
In 2006, production lines were established to serve export markets.
In 2011, the Drive Head business was sold to Dana India Private Limited.
The business has therefore accumulated more than four decades of experience in commercial-vehicle axle manufacturing.
Ownership Transformation
One of the most important developments for investors occurred in 2025.
Dana Global Products Inc. exited Axles India and the TSF Group acquired Dana’s stake.
TSF Investments’ FY2026 disclosures show:
TSF Investments Limited — 62.98%
Forge 2000 Private Limited — 21.17%
Wheels India Limited — 12.51%
Others — ~3.33%
TSF’s FY2026 annual report also states that Axles India became a subsidiary of TSF Investments from 2 May 2025.
This is strategically significant because Axles India is now more deeply integrated into the TSF automotive-component ecosystem.
Business Model
Axles India’s core business is manufacturing axle housings and axle beams for commercial vehicles.
Its products include:
Rear Axle Housings
These form part of the rear axle assembly used in commercial vehicles.
Tag / Trailer Axle Beams
Used in trailers and commercial vehicle applications.
Lift Axle Housings
Used in applications where additional axle support is required.
Cast Axle Housings
Specialised axle housing products.
The company also has engineering and application-development capabilities for commercial-vehicle platforms.
Product Portfolio
Axles India’s current official product portfolio includes:
- Rear axle housings
- Tag axle housings
- Trailer axle beams
- Lift axle housings
- Cast axle housings
- Related axle components
The company focuses on the Light, Medium and Heavy Commercial Vehicle segments as well as buses.
Manufacturing Footprint
Axles India currently operates three manufacturing locations.
Sriperumbudur, Tamil Nadu
This is the company’s original manufacturing base.
Cheyyar, Tamil Nadu
The facility was established in 1995 to cater to increasing domestic OEM demand.
Jamshedpur, Jharkhand
The company’s third plant expands its geographic manufacturing footprint.
The official company website states total annual axle-housing capacity of approximately:
4,00,000 axle housings
Capacity Utilisation
According to current unlisted-market research, Axles India maintained capacity utilisation above 90% across its manufacturing plants in FY2026.
High utilisation is important because axle manufacturing has a meaningful fixed-cost component.
Higher utilisation can therefore support:
- Better fixed-cost absorption
- Improved operating margins
- Better return on capital
- Stronger cash generation
However, sustained high utilisation can also eventually require capacity expansion.
Customers
Axles India supplies major commercial-vehicle and automotive customers.
The company’s official website lists customers including:
- Tata Motors
- VE Commercial Vehicles
- Daimler India Commercial Vehicles
- Dana India Commercial Vehicles
- SML Mahindra
- Mahindra Trucks & Buses
- K Drive Mobility Solutions
- Ashok Leyland
- Wheels India
The company also exports to Dana operations in:
- USA
- Mexico
- Brazil
- Australia
and to UD Trucks in:
- Thailand
- Japan
This provides Axles India with both domestic OEM and export exposure.
Export Business
Exports are an important part of the company’s history.
Axles India states that it has exported more than:
1.3 million axle housings globally
The company’s international exposure provides diversification beyond India’s commercial-vehicle cycle.
Industry Opportunity
Axles India operates in a segment directly linked to commercial-vehicle production.
Its long-term growth drivers include:
1. Commercial Vehicle Growth
Higher infrastructure spending, logistics activity and industrial production can support demand for medium and heavy commercial vehicles.
2. Replacement Demand
Commercial vehicles operate under high utilisation, creating recurring replacement demand for components.
3. Fleet Modernisation
Newer vehicles increasingly require higher-quality and more technically sophisticated components.
4. Export Opportunity
Indian auto-component manufacturers are increasingly integrated into global supply chains.
5. Localisation
OEMs increasingly seek domestic suppliers to reduce supply-chain dependence and optimise costs.
FY2025-26 Financial Performance
The company’s FY2026 results show moderate revenue growth but lower operating profitability.
Revenue from Operations
FY2025:
₹841.54 Cr
FY2026:
₹871.19 Cr
Growth:
~3.5%
Total Income
FY2025:
₹846.78 Cr
FY2026:
₹887.85 Cr
PBT
FY2025:
₹93.15 Cr
FY2026:
₹96.58 Cr
Growth:
~3.7%
PAT
FY2025:
₹68.70 Cr
FY2026:
₹73.24 Cr
Growth:
~6.6%
Therefore, FY2026 was a year of modest revenue growth with slightly better bottom-line growth.
Historical Financial Performance
| Financial Year | Revenue ₹ Cr | EBITDA ₹ Cr | PAT ₹ Cr |
|---|---|---|---|
| FY2021 | 306 | 8 | 3 |
| FY2022 | 569 | 54 | 34 |
| FY2023 | 746 | 85 | 53 |
| FY2024 | 854 | 129 | 86 |
| FY2025 | 841 | 101 | 69 |
| FY2026 | 871 | 111 | 73 |
The long-term picture is considerably stronger than the latest one-year growth rate suggests.
From FY2021 to FY2026, revenue increased from approximately ₹306 Cr to ₹871 Cr.
PAT increased from approximately ₹3 Cr to ₹73 Cr.
This demonstrates significant improvement in profitability over the period.
EBITDA Analysis
FY2026 EBITDA was approximately:
₹110.70 Cr
against:
₹101 Cr in FY2025
However, because revenue increased only moderately, EBITDA margin declined.
FY2025 EBITDA Margin
~12.0%
FY2026 EBITDA Margin
~12.7%
Different databases use slightly different EBITDA definitions, but the broader conclusion remains that Axles India operates with an EBITDA margin around the low-teens range.
Margin Trend
| Year | EBITDA Margin |
|---|---|
| FY2022 | ~9.5% |
| FY2023 | ~11.4% |
| FY2024 | ~15.1% |
| FY2025 | ~12.0% |
| FY2026 | ~10.8–12.7% depending on methodology |
The FY2024 margin peak has not been sustained.
This is an important point for investors.
The company remains profitable, but margin normalisation is one of the key factors to monitor.
Balance Sheet
FY2026 total assets were approximately:
₹543.03 Cr
against:
₹518.76 Cr in FY2025
FY2026 Assets
| Asset | FY2026 |
|---|---|
| PPE | ₹93.10 Cr |
| CWIP | ₹0.06 Cr |
| Investments | ₹3.04 Cr |
| Inventory | ₹151.25 Cr |
| Trade Receivables | ₹198.80 Cr |
| Cash & Cash Equivalents | ₹76.06 Cr |
| Other Assets | ~₹20.7 Cr |
| Total Assets | ₹543.03 Cr |
Net Worth
FY2026 equity/net worth was approximately:
₹369.49 Cr
This compares with approximately:
₹307.61 Cr
in FY2025 based on the reported balance sheet.
The increase reflects retained earnings and stronger accumulated reserves.
Debt Position
Axles India has a very comfortable debt position.
FY2026:
Non-current borrowings: ₹2.86 Cr
Current borrowings: ₹7.76 Cr
Total borrowings:
~₹10.62 Cr
The peer-comparison source reports total debt around ₹2.86 Cr under its debt definition, while the detailed balance sheet separately reports current borrowings of ₹7.76 Cr. Therefore, investors should use the audited annual report definition when calculating net debt.
Even using the broader ₹10.62 Cr figure, debt remains very small compared with net worth.
Debt / Equity
Approximately:
0.03x
This is a major positive.
Cash Position
FY2026 cash and cash equivalents:
₹76.06 Cr
This was substantially higher than:
₹29.49 Cr
in FY2025.
The increase in cash is particularly positive given the company’s low debt.
Working Capital
Working capital remains an important consideration.
FY2026:
Inventory
₹151.25 Cr
Trade Receivables
₹198.80 Cr
The combined inventory and receivables balance is approximately:
₹350 Cr
This is a large amount relative to annual revenue.
The good news is that working-capital efficiency improved according to available ratio data.
Inventory Days
FY2025: ~136 days
FY2026: ~113 days
Cash Conversion Cycle
FY2025: ~129 days
FY2026: ~109 days
This improvement is a positive sign.
Cash Flow
FY2026 operating cash generation was strong.
Current research sources report operating cash flow of approximately:
₹98.81 Cr
for FY2026.
This is particularly encouraging because:
PAT ≈ ₹73 Cr
while:
Operating cash flow ≈ ₹99 Cr
This indicates good cash conversion in FY2026.
Return Ratios
FY2026:
ROE
~19.8%
ROCE
~21.3%
These are healthy returns for an auto-component manufacturing business.
The key question is whether these returns can remain above 18–20% through the commercial-vehicle cycle.
Dividend
Axles India has a history of returning capital to shareholders.
For FY2026, the company recommended a final dividend of:
₹32/share
on the ₹10 face value.
That represents:
320% of face value
At 2.55 Cr shares, the gross dividend outflow would be approximately ₹81 Cr if the ₹32 final dividend applies to the entire outstanding share count, subject to the company’s final corporate actions and eligibility.
This is notable because the dividend is higher than FY2026 PAT if considered alone, so investors should verify the exact dividend structure and any interim dividend before interpreting the payout ratio.
Strategic Importance of TSF Group
The change in ownership is arguably the biggest corporate development for Axles India.
TSF Investments is a significant automotive-focused investment group.
Its portfolio includes:
- Brakes India
- Turbo Energy
- Wheels India
- India Motor Parts & Accessories
- Dunes Oman
- Sundaram Dynacast
- Transenergy
TSF’s FY2026 report identifies Axles India as a subsidiary with a 62.98% holding.
This gives Axles India access to a broader ecosystem covering:
- Braking systems
- Wheels
- Turbochargers
- Automotive distribution
- Forging
- Castings
- Other vehicle components
This could potentially create opportunities for operational and commercial synergies.
Product Focus Shift
Current industry research indicates that Axles India has been phasing out lower-margin suspension business and concentrating resources on higher-value axle housing segments and defence opportunities.
If executed successfully, this could improve:
- Product mix
- Margin profile
- Capacity utilisation
- Return on capital
The shift toward higher-value products is therefore an important area to monitor.
Defence Opportunity
Axles India has reportedly been exploring opportunities in defence applications.
This could provide a new revenue stream beyond conventional commercial vehicles.
However, defence-related business should currently be viewed as a potential growth opportunity rather than a guaranteed earnings driver unless material orders and revenues are disclosed.
Competitive Advantages
1. Established OEM Relationships
Axles India has decades-long relationships with major commercial-vehicle manufacturers.
2. Manufacturing Scale
Approximately 4 lakh annual axle-housing capacity provides meaningful scale.
3. Engineering Expertise
The company has specialised application knowledge and design-validation capabilities.
4. Export Capability
More than 1.3 million axle housings have reportedly been exported globally.
5. Strong Parent Ecosystem
TSF’s automotive portfolio creates strategic advantages.
6. Low Debt
Very low leverage provides balance-sheet flexibility.
7. High Capacity Utilisation
Utilisation above 90% provides strong asset productivity.
Industry Risks
Commercial Vehicle Cycle
Axles India’s earnings are closely linked to commercial-vehicle production.
A downturn in:
- Truck sales
- Bus sales
- Infrastructure activity
- Freight movement
can affect volumes.
Raw Material Costs
Steel and other input costs can significantly influence margins.
Customer Concentration
Large OEM customers have bargaining power over suppliers.
Margin Pressure
The decline from FY2024’s stronger margin profile shows the cyclicality of profitability.
Working Capital
Receivables and inventory remain substantial.
Technology Transition
Electric commercial vehicles could alter axle architecture and component requirements over time.
Unlisted Liquidity
Investors cannot rely on NSE/BSE liquidity for exit.
EV Transition Risk
Electrification represents both a risk and an opportunity.
Traditional internal-combustion vehicles use complex mechanical systems that can differ from EV architectures.
However, heavy commercial vehicles are expected to electrify more gradually than passenger cars because of:
- Battery weight
- Charging infrastructure
- Range requirements
- Payload economics
- Total cost of ownership
Therefore, Axles India’s commercial-vehicle exposure does not automatically make the business structurally obsolete.
The company will nevertheless need to adapt its product portfolio as vehicle platforms evolve.
Current Unlisted Share Price
There is no NSE/BSE traded price for Axles India.
Current private-market references vary materially.
UnlistedZone
Approximately:
₹585/share
as of 11 September 2026.
52-week range:
₹425–₹750
Market capitalisation:
~₹1,491 Cr
P/E:
~20.3x
Moneycontrol
Approximately:
₹494.70/share
with a 52-week range of approximately ₹443.75–₹657.50.
Reported P/E:
~17.75x
WWIPL
Latest displayed reference:
₹510/share
Important
These are indicative private-market references, not exchange-traded prices.
The large difference between ₹495 and ₹585 demonstrates the liquidity and price-discovery limitations of unlisted shares.
Market Capitalisation
Using approximately 2.55 Cr shares:
At ₹495
Market cap ≈ ₹1,262 Cr
At ₹510
Market cap ≈ ₹1,300 Cr
At ₹585
Market cap ≈ ₹1,491 Cr
This is a significant valuation difference for the same underlying business.
Valuation
FY2026 EPS:
₹28.74
Therefore:
At ₹495
P/E ≈ 17.2x
At ₹510
P/E ≈ 17.7x
At ₹585
P/E ≈ 20.4x
The stock is therefore no longer a low-single-digit P/E value stock.
It is better described as a quality auto-component company trading around 17–20x FY2026 earnings.
Price-to-Book
FY2026 book value per share is approximately:
₹145
Therefore:
At ₹495
P/B ≈ 3.4x
At ₹510
P/B ≈ 3.5x
At ₹585
P/B ≈ 4.0x
This means investors are paying a substantial premium to book value for:
- Strong ROE
- Low debt
- OEM relationships
- Manufacturing capability
- TSF backing
- Future growth opportunities
Valuation Sensitivity
Using FY2026 EPS of approximately ₹28.74:
| P/E Multiple | Indicative Value |
|---|---|
| 12x | ₹345 |
| 14x | ₹402 |
| 16x | ₹460 |
| 18x | ₹517 |
| 20x | ₹575 |
| 22x | ₹632 |
| 25x | ₹719 |
This is not a target price; it is simply a sensitivity table.
At around ₹500, the market is effectively assigning approximately an 17–18x earnings multiple.
At ₹585, the valuation is closer to 20x earnings.
Peer Comparison
A useful way to understand Axles India’s valuation is to compare it with listed auto-component companies.
FY2026
| Metric | Axles India | Automotive Axles | GNA Axles |
|---|---|---|---|
| Revenue | ₹871 Cr | ₹2,178 Cr | ₹1,478 Cr |
| PAT | ₹73 Cr | ₹164 Cr | ₹117 Cr |
| EBITDA Margin | ~12.7% | ~12.4% | ~16.3% |
| ROE | ~19.8% | ~15.0% | ~11.7% |
| Debt | Very low | Nil | ~₹184 Cr |
| P/E | ~18.6x* | ~15.5x | ~20.2x |
*Based on the ₹535 reference price used in the peer comparison.
This indicates that Axles India is not obviously cheap versus listed peers.
Its valuation needs to be justified by:
- Strong parentage
- High utilisation
- Low debt
- Growth opportunities
- Potential margin improvement
- Defence/export opportunity
What Could Drive Earnings Growth?
1. Commercial Vehicle Recovery
A stronger truck and bus cycle would directly benefit Axles India.
2. Capacity Expansion
Higher capacity can support revenue growth if demand remains strong.
3. Product Mix Improvement
Moving toward higher-value axle products can improve margins.
4. Defence
Successful entry into defence applications could create incremental revenue.
5. Exports
Increasing exports can diversify revenue.
6. TSF Synergies
The larger TSF automotive ecosystem could create new opportunities.
7. Working Capital Improvement
Further reduction in inventory and receivable days could release cash.
Key Investment Positives
Strong business franchise: More than four decades in axle manufacturing.
Major OEM customers: Tata Motors, Ashok Leyland, Mahindra, Daimler India, VE Commercial Vehicles and others.
Strong manufacturing base: Three plants and ~4 lakh annual capacity.
High utilisation: Above 90% according to current research.
Low debt: Debt/equity around 0.03x.
Healthy ROE: ~19.8%.
Healthy ROCE: ~21.3%.
Strong cash position: ~₹76 Cr.
Positive operating cash flow: ~₹99 Cr reported for FY2026.
TSF Group ownership: 62.98%.
Dana exit: Removes the uncertainty associated with the former foreign JV partner and gives the TSF Group greater control.
Key Risks
1. Valuation
At ₹500–₹585, the company is already valued around 17–20x FY2026 earnings.
2. Margin Normalisation
FY2024 margins were materially stronger than the current level.
3. Commercial Vehicle Cyclicality
A slowdown in trucks and buses could impact revenue.
4. Customer Concentration
Dependence on major OEMs creates bargaining-power risk.
5. Working Capital
Receivables and inventory remain large.
6. EV Transition
Future commercial-vehicle architecture could alter the demand for traditional axle components.
7. Unlisted Liquidity
The investor may not be able to exit quickly.
8. Price Dispersion
Current private-market quotes range significantly between intermediaries.
Overall Assessment
| Parameter | Assessment |
|---|---|
| Business Quality | ★★★★☆ |
| Industry Position | ★★★★☆ |
| OEM Relationships | ★★★★★ |
| Revenue Growth | ★★★☆☆ |
| Profitability | ★★★★☆ |
| Balance Sheet | ★★★★★ |
| Debt Position | ★★★★★ |
| Cash Generation | ★★★★☆ |
| ROE / ROCE | ★★★★☆ |
| Growth Opportunity | ★★★★☆ |
| Valuation at ~₹500 | ★★★☆☆ |
| Valuation at ~₹585 | ★★½☆☆ |
| Unlisted Liquidity | ★★☆☆☆ |
Final Investment View
Axles India is a high-quality, financially conservative auto-component business, but the investment case has to be separated from the valuation.
The company itself has several attractive characteristics:
₹871 Cr revenue
₹73 Cr PAT
~₹111 Cr EBITDA
~20% ROE
~21% ROCE
~₹76 Cr cash
very low debt
and
90%+ reported capacity utilisation.
The ownership transition is also strategically positive.
TSF Investments now owns 62.98%, while Forge 2000 owns 21.17% and Wheels India owns 12.51%.
This makes Axles India an important part of the broader TSF automotive ecosystem.
However, valuation is the key issue.
At approximately ₹495:
P/E ≈ 17x
At approximately ₹510:
P/E ≈ 18x
At approximately ₹585:
P/E ≈ 20x
Therefore, the company does not offer an obvious deep-value entry point.
The investment becomes more compelling if:
- Commercial-vehicle volumes accelerate
- EBITDA margins recover toward 13–15%
- Capacity remains highly utilised
- Defence business develops meaningfully
- Exports increase
- Working-capital efficiency improves
- Earnings compound at double digits
Bottom Line
Axles India is a fundamentally strong unlisted auto-component company with excellent parentage, low leverage, established OEM relationships and attractive return ratios.
At ₹500 or below, the risk-reward appears considerably more balanced.
At ₹575–₹585, the investor is paying a premium for future growth and therefore needs stronger earnings growth to justify the valuation.
For UnlistedCart, I would position Axles India as:
“A high-quality commercial-vehicle component franchise backed by the TSF Group — strong balance sheet and OEM relationships, but valuation now depends on the next phase of earnings growth.”
Important Links
Official Company Website:
Axles India Limited
Official Company Overview:
Axles India – About Us
Official Annual Reports:
Axles India – Annual Reports
Official Annual Returns:
Axles India – Annual Returns
TSF Investments – Axles India Portfolio:
TSF Investments – Axles India
Current Unlisted Price Reference – UnlistedZone:
Axles India – UnlistedZone
Current Unlisted Price Reference – Moneycontrol:
Axles India – Moneycontrol
Financials & Annual Report Data:
Axles India – Financials
Disclaimer
This report is prepared for informational and research purposes only and should not be construed as investment advice, an offer to buy or sell securities, or a guarantee of future returns.
Axles India Limited is an unlisted company. Prices quoted by private-market intermediaries are indicative and may differ substantially depending on quantity, availability, liquidity, seller and settlement terms.
Financial information should be independently verified against the latest audited annual report and corporate records. Investors should independently evaluate customer concentration, related-party transactions, working capital, corporate actions, ownership changes, taxation, litigation and actual executable transaction prices before investing.
The valuation calculations in this report are sensitivity analyses and should not be interpreted as target prices.
For more such unlisted stocks visit https://unlistedcart.com/unlisted-shares/