
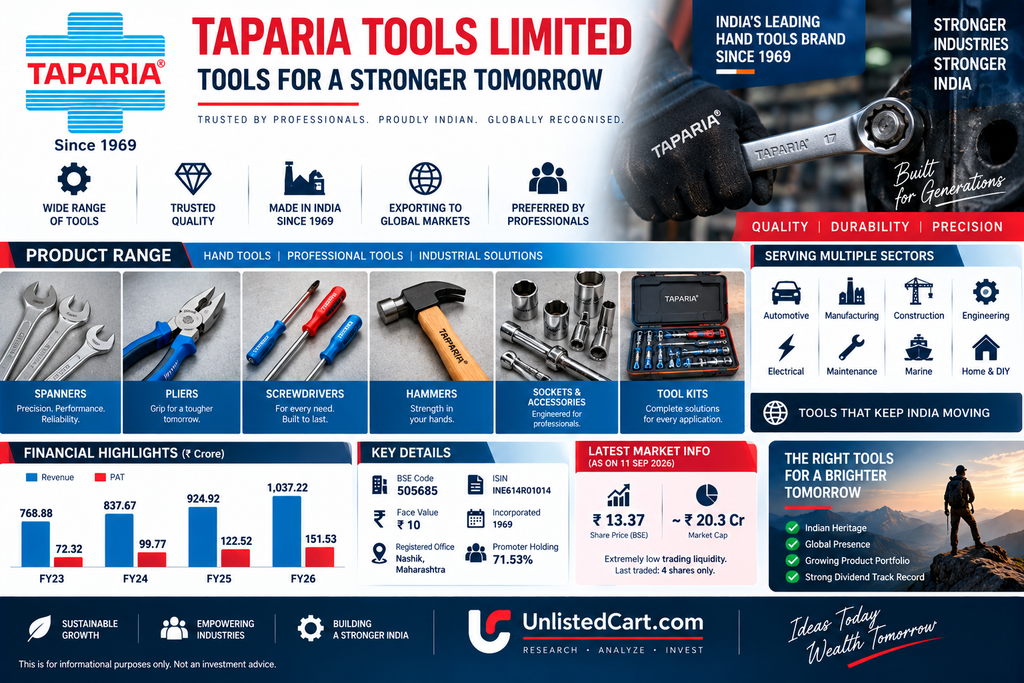
BSE: 505685 | ISIN: INE614R01014 | Face Value: ₹10
Category: BSE-listed, extremely illiquid small-cap
Industry: Hand Tools / Engineering Products
Registered Office: Nashik, Maharashtra
Established: 1969
Latest available market price: ₹13.37 per share
Latest reported market capitalisation: ~₹20.3 Crore
Latest traded date: 11 September 2026
Important status note: Taparia Tools Limited is currently listed on the Bombay Stock Exchange, rather than being an unlisted private-market company. However, its trading liquidity is exceptionally low, making it relevant to investors who research the illiquid/unlisted-equity segment.
1. Executive Summary
Taparia Tools is one of India’s oldest hand-tool manufacturers, with a history going back to 1969. The company began manufacturing hand tools in India through technical collaboration with Bahco of Sweden and subsequently absorbed the production technology of its collaborator.
The company manufactures and trades a broad range of hand tools including spanners, pliers, screwdrivers, hammers, clamps, sockets, cutters, chisels, punches, torque wrenches and tool kits. Its current product portfolio has also expanded into power-tool accessories, electrical and insulated tools, storage products, lifting equipment and abrasive products.
Financially, Taparia has shown strong growth over the last few years:
| Financial Year | Revenue | PAT |
|---|---|---|
| FY23 | ₹768.88 Cr | ₹72.32 Cr |
| FY24 | ₹837.67 Cr | ₹99.77 Cr |
| FY25 | ₹924.92 Cr | ₹122.52 Cr |
| FY26 | ₹1,037.22 Cr | ₹151.53 Cr |
FY26 revenue increased approximately 12.1%, while PAT increased approximately 23.7% on a year-on-year basis.
The most striking feature of the stock is the gap between its reported financial strength and its market price. At ₹13.37, the reported FY26 EPS of ₹99.83 implies a headline P/E of only around 0.13x, while book value is reported around ₹318 per share.
However, this headline valuation needs to be interpreted carefully because the share price underwent a major adjustment following the company’s large dividend distributions. The company paid ₹32.50 interim dividend and approved ₹35 final dividend for FY26, totalling ₹67.50 per share.
2. Company Overview
Taparia Tools was established in 1969 and has developed into an established Indian hand-tool brand.
The company initially worked with Swedish technical expertise and subsequently absorbed the production technology internally. Its official website states that the company operates manufacturing facilities in Nashik and Goa and has dedicated R&D and quality-control capabilities.
The company has historically exported its products to multiple international markets and has built a distribution network across India. Its earlier corporate profile reported more than 800 distributors across India.
Official company website: Taparia Tools
3. Business Model
Taparia operates across two major revenue categories:
A. Manufactured Products
The company manufactures a wide range of hand tools, including:
- Spanners
- Pliers
- Screwdrivers
- Hammers
- Clamps
- Sockets
- Chisels
- Punches
- Cutters
- Pipe wrenches
- Torque wrenches
- Tool kits
- Non-sparking tools
The company has also expanded into newer categories such as hydraulic jacks, tool bags, gear wrenches, hole saws, crimping tools and other accessories.
B. Traded Products
An important point for investors is that Taparia is not purely a manufacturing business.
In FY25, revenue from operations included approximately:
- Manufactured products: ₹281.93 Cr
- Traded products: ₹630.96 Cr
Therefore, roughly 31% of product sales came from manufactured products while approximately 69% came from traded products during FY25.
This distinction is important when comparing Taparia with pure-play hand-tool manufacturers.
4. Manufacturing & Product Ecosystem
Taparia’s official product portfolio currently spans:
Hand Tools → Power Tool Accessories → Electrical & Insulated Tools → Storage Products & Tool Kits → Lifting Equipment → Abrasive Products.
The company maintains manufacturing and quality-control infrastructure with processes including forging, machining, heat treatment, polishing and plating. Its historical corporate profile states that the company uses dedicated R&D and CAD capabilities for product and tooling development.
Product catalogue: Taparia Tools Product Range
5. Financial Performance
Revenue & Profit Growth
| ₹ Crore | FY23 | FY24 | FY25 | FY26 |
|---|---|---|---|---|
| Revenue | 768.88 | 837.67 | 924.92 | 1,037.22 |
| PAT | 72.32 | 99.77 | 122.52 | 151.53 |
| EPS | ~47.65 | 65.73 | 80.72 | 99.83 |
FY26 represented another year of growth, with revenue rising to approximately ₹1,037.22 Cr and PAT reaching ₹151.53 Cr.
The five-year historical trend also shows a substantial increase in profitability from FY21 onwards.
6. FY26 Profitability
FY26 financial performance:
- Revenue: ₹1,037.22 Cr
- Profit before interest & depreciation: ₹205.38 Cr
- Finance cost: ₹0.26 Cr
- Depreciation: ₹2.91 Cr
- PBT: ₹202.22 Cr
- PAT: ₹151.53 Cr
- Total comprehensive income: ₹151.77 Cr
The operating margin based on profit before interest and depreciation was approximately 19.8%.
The company therefore continues to generate substantial operating profitability relative to its very small quoted market capitalisation.
7. FY26 Balance Sheet
FY26 balance-sheet data indicates:
| Particular | FY26 |
|---|---|
| Total Assets | ~₹520.68 Cr |
| Net Worth | ~₹435.52 Cr |
| Investments | ~₹216 Cr |
| Inventory | ~₹172.15 Cr |
| Trade Receivables | ~₹87.08 Cr |
| Cash & Equivalents | ~₹6.07 Cr |
| Borrowings | Nil |
| Current Liabilities | ~₹80.08 Cr |
The company therefore has a debt-free balance sheet according to the latest financial data.
A particularly notable feature is the company’s investment portfolio. Investments were approximately ₹216 Cr by FY26, considerably higher than the company’s current quoted market capitalisation.
8. Cash Flow Analysis
Cash generation has remained positive.
FY26:
- Operating cash flow: approximately ₹137.34 Cr
- Investing cash flow: approximately –₹49.14 Cr
- Financing cash flow: approximately –₹87.94 Cr
- Closing cash: approximately ₹6.07 Cr
The company has therefore generated substantial operating cash while simultaneously returning significant capital to shareholders through dividends.
9. Working Capital
Working capital deserves attention.
FY26 inventory stood around ₹172 Cr, while trade receivables were approximately ₹87 Cr.
This means that although the company is profitable and debt-free, a substantial amount of capital remains deployed in inventory and receivables.
The FY25 annual report reported an inventory turnover ratio of 3.46x and trade receivables turnover of approximately 11.59x.
Investors should therefore monitor:
- Inventory days
- Receivable days
- Inventory growth versus sales
- Operating cash flow versus PAT
- Working-capital intensity
10. Shareholding Pattern
As of March 2026:
- Promoters: 71.53%
- Public shareholders: 28.47%
The company had approximately 1,619 shareholders according to the latest shareholding information.
The relatively high promoter holding combined with a small public float contributes to the stock’s extremely low liquidity.
11. Bonus Issue & Capital Structure
In 2023, Taparia increased its authorised share capital and issued 4 bonus shares for every 1 existing share.
Following the bonus issue, paid-up equity share capital became approximately ₹15.18 Cr, representing 1,51,78,750 equity shares of ₹10 each.
This is important when comparing older historical prices and EPS figures because pre-bonus and post-bonus numbers are not directly comparable without adjustment.
12. Dividend Track Record
Dividend distribution is one of the most unusual features of Taparia Tools.
Recent dividends
| Financial Year | Total Dividend/Share |
|---|---|
| FY23 | ₹155.00 |
| FY24 | ₹40.00 |
| FY25 | ₹50.00 |
| FY26 | ₹67.50 |
For FY26, the company paid:
- Interim dividend: ₹32.50/share
- Final dividend: ₹35/share
- Total: ₹67.50/share
The final dividend was approved at the AGM held on 29 July 2026.
At the latest quoted price of ₹13.37, the trailing dividend mathematically corresponds to a yield of approximately 505%.
However, this should not be interpreted as a prospective 505% yield. The share price fell sharply around the July 2026 ex-dividend event, and the current price is therefore a post-dividend price. Historical dividend yield calculations can be highly misleading in such a situation.
13. Latest Quarterly Performance – Q1 FY27
The latest available quarterly numbers for the quarter ended June 2026 show continued growth.
Q1 FY27:
- Total revenue: approximately ₹279.68 Cr
- Operating profit: approximately ₹62.02 Cr
- PAT: approximately ₹47.76 Cr
- Operating margin: approximately 22.2%
- EPS: approximately ₹31.46
Revenue increased approximately 14% YoY, while PAT increased approximately 38% YoY according to the BSE-reported quarterly data.
This provides evidence that the strong FY26 performance continued into the first quarter of FY27.
14. Current Market Price & Liquidity
The latest available traded price is:
₹13.37 per share
Date: 11 September 2026
Market capitalisation: approximately ₹20.3 Cr
52-week range: ₹10.50 – ₹37.08
However, liquidity is exceptionally poor.
The latest reported session had only 4 shares traded. Historical trading data also shows extremely small volumes on many trading days.
This means the quoted price should not be treated in the same way as the price of a liquid NSE/BSE stock.
For an investor trying to buy or sell a meaningful quantity, the actual executable price may differ materially from the displayed market price.
15. Valuation Snapshot
At ₹13.37:
| Valuation Metric | Approx. Value |
|---|---|
| Market Cap | ~₹20.3 Cr |
| FY26 EPS | ₹99.83 |
| P/E | ~0.13x |
| Book Value | ~₹318/share |
| P/B | ~0.04x |
| FY26 Dividend | ₹67.50/share |
| Dividend Yield on current price | ~505% |
The extremely low P/E and P/B ratios are mathematically correct using the reported figures, but they should not be viewed in isolation.
The key reason is the stock’s unusual capital-return profile and extremely low liquidity. The ₹13.37 market price is also a post-dividend price after a ₹35 final dividend went ex-dividend in July 2026.
16. Investment Assets vs Market Capitalisation
One of the most interesting aspects of Taparia is the relationship between its investment portfolio and quoted equity value.
FY26 investments were approximately ₹216 Cr, compared with a quoted market capitalisation of only around ₹20 Cr.
This creates a very unusual situation where the reported value of financial investments alone is several times the company’s quoted equity value.
However, investors should undertake detailed due diligence on:
- Nature of investments
- Market value versus carrying value
- Mutual fund composition
- Tax implications
- Distribution of surplus capital
- Related-party considerations
- Future capital-allocation policy
before drawing any conclusion from this comparison.
17. Key Competitive Advantages
Long Operating History
Taparia has been operating since 1969 and has developed decades of manufacturing and distribution experience.
Established Brand
The company has built recognition in the Indian hand-tool market and continues to sell across a broad product range.
Manufacturing Capability
Its manufacturing infrastructure includes forging, machining, heat treatment, polishing and plating capabilities.
Wide Product Portfolio
The company has products covering professional tools, DIY tools, electrical tools, accessories, lifting equipment and other categories.
Export Presence
Taparia has historically exported products to multiple international markets.
Debt-Free Balance Sheet
Latest financial data indicates zero borrowings, reducing financial leverage risk.
18. Growth Drivers
1. India’s Manufacturing & Infrastructure Expansion
Industrialisation, construction, automotive repair, electrical work and general maintenance create recurring demand for tools.
2. Product Expansion
The company is expanding beyond traditional hand tools into accessories, lifting products, storage, abrasives and other categories.
3. Export Opportunity
Taparia’s existing international presence provides a platform for further export growth.
4. Brand-Led Demand
A recognised domestic brand can potentially benefit from replacement demand and professional usage.
5. Strong Internal Cash Generation
The company’s operating cash flow and low debt provide flexibility for working capital, investment and shareholder distributions.
19. Key Risks
Extremely Low Liquidity
This is arguably the biggest risk.
A displayed market price of ₹13.37 does not guarantee that an investor can buy or sell a meaningful quantity around that price.
Large Inventory
Inventory of approximately ₹172 Cr represents a significant amount of capital relative to the company’s sales and net worth.
Traded Product Dependence
Approximately 69% of FY25 product sales came from traded products, rather than manufactured products.
Low Market Capitalisation
Despite more than ₹1,000 Cr of annual revenue and ₹150 Cr+ PAT, the quoted market capitalisation is only around ₹20 Cr. This extreme disconnect is partly a function of the stock’s illiquidity and dividend-adjusted price.
Dividend Sustainability
The historical dividend is exceptionally high relative to the current quoted price. Investors should not assume that future dividends will remain at the same level.
Raw Material Prices
Steel and other input costs can influence margins.
Competition
The company itself identifies competition from low-cost imports as one of the industry threats.
Price Discovery Risk
The stock can remain disconnected from fundamental value for extended periods because of limited trading.
20. IPO / Listing Status
Taparia Tools is already listed on BSE under:
Scrip Code: 505685
ISIN: INE614R01014
It is not an unlisted private company requiring an IPO.
The company continues to file BSE disclosures and quarterly results.
21. Overall Assessment
Taparia Tools presents an unusual combination of:
- More than five decades of operating history
- ₹1,037 Cr+ FY26 revenue
- ₹151 Cr+ FY26 PAT
- Strong recent earnings growth
- Debt-free balance sheet
- Significant financial investments
- High promoter ownership
- Strong dividend history
- Extremely low quoted market capitalisation
- Extremely low trading liquidity
The financial statements are substantially stronger than what the quoted market capitalisation might initially suggest.
At the same time, the extremely low liquidity means that the quoted ₹13.37 price should not automatically be interpreted as a readily executable valuation.
For research purposes, Taparia is therefore better viewed as an extremely illiquid BSE-listed value/special-situation company, rather than a conventional liquid listed stock.
The most important areas for further due diligence are:
- Exact composition and fair value of the ₹216 Cr investment portfolio
- Sustainability of future dividend distributions
- Inventory and working-capital efficiency
- Manufactured versus traded product mix
- Promoter/public shareholding and actual free float
- Ability to enter or exit the stock at a reasonable price
- Future capital allocation
- Normalised earnings after considering dividend-related price adjustments
22. Important Links
Company website: Taparia Tools Official Website
Company profile: Taparia Tools – About Us
Products: Taparia Tools Product Range
Annual Reports: Taparia Tools Annual Reports
FY23–FY24 Annual Report: Taparia Tools FY2023-24 Annual Report
Disclaimer
This report is prepared for informational and research purposes only and should not be considered investment advice, a recommendation to buy or sell securities, or a guarantee of future returns.
Taparia Tools is currently BSE-listed but extremely illiquid. Market prices shown may not represent the price at which a substantial quantity can actually be bought or sold. Investors should independently verify financial statements, shareholding, dividend announcements, tax implications, liquidity and applicable regulatory information before making any investment decision.
For more such unlisted stocks visit https://unlistedcart.com/unlisted-shares/