Company: T. Stanes and Company Limited
CIN: U02421TZ1910PLC000221
ISIN: INE420F01011
Face Value: ₹10 per share
Shares Outstanding: 23,66,184
Status: Active Unlisted Public Company
Registered Office: 8/23-24, Race Course Road, Coimbatore, Tamil Nadu
Group: Amalgamations Group
Industry: Agri Inputs, Crop Care & Biologicals
Latest Financial Year: FY2025-26
Official Website: T. Stanes and Company Limited
Official Investor Relations / Annual Accounts: T. Stanes Investor Relations
Executive Summary
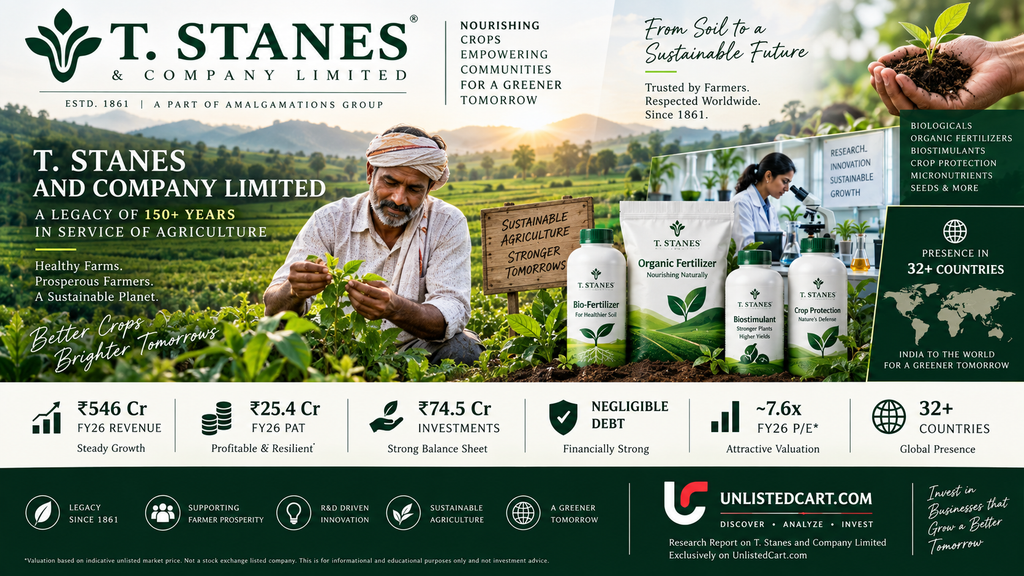
T. Stanes and Company Limited is one of India’s oldest agricultural businesses, with its heritage tracing back to 1861. The company became part of the Amalgamations Group in 1961 and has progressively evolved from its historical plantation and trading activities into an agriculture-focused business.
Today, the company operates primarily across agricultural inputs and crop-care solutions, including bio-fertilisers, organic fertilisers, micronutrients, biostimulants, botanical pesticides, microbial crop-protection products, seeds and other agricultural solutions.
The company states that it has a presence across 32+ countries, serving farmers through its domestic and international crop-care businesses.
The financial performance is also healthy.
FY2026 Consolidated Financial Highlights
| Particular | FY2025 | FY2026 |
|---|---|---|
| Revenue from Operations | ₹526.51 Cr | ₹546.19 Cr |
| Other Income | ₹5.47 Cr | ₹7.93 Cr |
| Total Income | ₹531.98 Cr | ₹554.12 Cr |
| PBT | ₹32.74 Cr | ₹34.13 Cr |
| PAT | ₹24.42 Cr | ₹25.42 Cr |
| EPS | ₹103.22 | ₹107.44 |
| Operating Cash Flow | ₹16.47 Cr | ₹17.75 Cr |
Revenue increased approximately 3.7%, while PAT increased approximately 4.1% in FY2026.
The balance sheet is another important positive.
FY2026 consolidated equity attributable to the company was approximately ₹240.70 Cr, with only around ₹0.01 Cr of borrowings reported at year-end. The company also held approximately ₹74.52 Cr of investments across current and non-current investments.
At current indicative unlisted prices around ₹820–₹825/share, the company is valued at approximately ₹194–195 Cr, implying roughly 7.6–7.7x FY2026 earnings.
That makes T. Stanes considerably more interesting from a valuation perspective than many unlisted businesses trading at very high multiples.
Company Background
T. Stanes traces its history to 1861, when Sir Robert Stanes established the business in Coimbatore. The company initially operated in coffee curing and plantation activities and later expanded into several industries that contributed to the development of Coimbatore’s industrial ecosystem.
The company became part of the Amalgamations Group in 1961.
Over the following decades, T. Stanes increasingly focused on agriculture and developed expertise in biological and sustainable agricultural inputs.
The company states that it began expanding into bio-products, organic fertilisers, growth regulators and biological pest-control products during the late 1980s, following investment in R&D.
Business Model
T. Stanes operates across several agricultural product categories.
1. Bio-Fertilisers
The company develops and markets biological products designed to improve soil health and nutrient availability.
2. Organic Fertilisers
Its portfolio includes organic agricultural inputs aimed at improving soil fertility and supporting sustainable agriculture.
3. Micronutrients
Micronutrient products help address deficiencies of essential nutrients required for crop development.
4. Biostimulants
This is an increasingly important part of the agricultural-input industry.
Biostimulants are designed to improve plant growth, crop quality and stress tolerance.
T. Stanes continues to launch products in this category, including newer formulations such as Splendor Super.
5. Biological Crop Protection
The company offers microbial and botanical solutions for:
- Insect management
- Disease management
- Nematode management
- Pest control
- Soil health
Its official domestic crop-care portfolio includes fertilizers, water-soluble fertilizers, organic fertilizers, bio-fertilizers, micronutrients, biostimulants, disease-management products, traps, insect/nematode management, chemical crop care and seeds.
6. Seeds
Seeds form another component of the company’s agriculture portfolio.
7. International Crop Care
The company has developed an international business covering:
- Nutrient management
- Pest management
- Disease management
- Water management
- Biostimulants
- Seed coating
The company currently states that it serves customers across 32+ countries.
Geographic Presence
T. Stanes has a strong South Indian heritage but its business is no longer restricted to the domestic southern market.
The company has developed an international export footprint and states that it has presence in 32+ countries.
This provides geographical diversification and potentially reduces dependence on any single domestic agricultural market.
Competitive Position
The company’s key competitive advantages include:
Legacy & Brand
More than 150 years of operating history provides substantial institutional knowledge and brand credibility.
Agricultural R&D
T. Stanes has historically invested in R&D and developed expertise in biological agricultural solutions.
Biological Product Portfolio
The company operates in categories such as:
- Bio-fertilisers
- Biopesticides
- Biostimulants
- Organic fertilisers
- Microbial solutions
- Botanical products
These are structurally attractive categories as farmers and regulators increasingly focus on sustainable agricultural practices.
Distribution Network
The business has historically built a substantial rural distribution network. A Tamil Nadu government employer profile describes the business as having a network of more than 12,000 dealers and more than 200 field sales and service personnel, although this should be treated as a historical reference rather than a confirmed FY2026 figure.
FY2025-26 Financial Performance
FY2026 was another year of profitable growth.
Revenue
Revenue from operations increased from:
₹526.51 Cr → ₹546.19 Cr
Growth:
~3.7%
PAT
PAT increased from:
₹24.42 Cr → ₹25.42 Cr
Growth:
~4.1%
PBT
PBT increased from:
₹32.74 Cr → ₹34.13 Cr
Growth:
~4.2%
The growth rate is not exceptionally high, but the company has maintained profitability while operating with very low financial leverage.
Profitability
FY2026:
PAT: ₹25.42 Cr
Revenue: ₹546.19 Cr
Approximate consolidated net margin:
4.65%
The reported financial-ratio data places net profit margin at approximately 4.57% and ROCE at approximately 13.10%.
The business is therefore profitable but operates with relatively modest margins, which is normal for an agricultural-input business with a significant distribution and product portfolio.
Cash Flow Analysis
One of the stronger aspects of T. Stanes is its ability to convert earnings into operating cash.
Operating Cash Flow
FY2025:
₹16.47 Cr
FY2026:
₹17.75 Cr
This represents approximately 7.8% growth.
The company generated ₹26.13 Cr of cash from operations before taxes and subsequently paid approximately ₹8.38 Cr in income taxes.
This indicates that reported profits are supported by actual operating cash generation.
Working Capital
Working capital requires monitoring.
During FY2026:
Inventory increased by ₹7.18 Cr
and
Trade receivables increased by ₹9.25 Cr.
This tied up additional cash in working capital.
The trade-receivables turnover ratio declined from 7.43x to 6.56x, indicating somewhat slower collection.
This is not currently a major concern because operating cash flow remained positive, but it is an important metric to monitor.
Balance Sheet Strength
The balance sheet is one of T. Stanes’ strongest characteristics.
FY2026 Consolidated Assets
| Asset | FY2026 |
|---|---|
| PPE | ₹43.88 Cr |
| CWIP | ₹5.53 Cr |
| Investment Property | ₹2.19 Cr |
| Investments – Non-current | ₹46.08 Cr |
| Investments – Current | ₹28.44 Cr |
| Inventory | ₹80.00 Cr |
| Trade Receivables | ₹86.91 Cr |
| Cash & Cash Equivalents | ₹12.45 Cr |
| Other Bank Balances | ₹4.20 Cr |
| Total Assets | ₹331.09 Cr |
The investment portfolio is particularly noteworthy.
Total investments:
₹74.52 Cr
This is a significant asset relative to the company’s approximately ₹194–195 Cr current market value.
Debt Position
T. Stanes has very low financial leverage.
FY2026 reported borrowings:
~₹0.01 Cr
The company also incurred only ₹0.78 Cr of finance costs during the year.
This provides considerable balance-sheet flexibility.
The business therefore has significantly lower financial risk than many manufacturing and agri-input companies carrying substantial debt.
Investment Portfolio
The company’s investment portfolio is an important component of its overall value.
FY2026:
Non-current investments: ₹46.08 Cr
Current investments: ₹28.44 Cr
Total:
₹74.52 Cr
The company also generated investment-related income, including dividend, interest and gains on financial assets.
This creates a degree of diversification beyond the core operating business.
Dividend History
T. Stanes has historically returned cash to shareholders.
For FY2025, the company recommended:
Interim Dividend: ₹12/share
Final Dividend: ₹7.50/share
Total Dividend: ₹19.50/share
This represented a 195% dividend on the ₹10 face value and a total payout of approximately ₹4.61 Cr.
For an unlisted company, the combination of profitability, low debt and dividend distribution is a positive characteristic.
Shareholding
Current unlisted-market data reports promoter/promoter-group ownership of approximately 73.29%, with the remaining shares held by public/non-promoter shareholders.
The concentrated ownership structure can be positive because the controlling group has a significant economic interest in the company.
However, it also contributes to limited liquidity in the unlisted market.
Amalgamations Group
T. Stanes is part of the Amalgamations Group, one of India’s established business groups.
This provides the company with access to a broader industrial ecosystem and long-term corporate heritage.
The group association is also relevant when evaluating the company’s governance, related-party transactions and capital allocation.
Industry Opportunity
The agricultural-input industry is undergoing structural changes.
Several trends are favourable for T. Stanes:
1. Sustainable Agriculture
Increasing focus on reducing excessive chemical usage is supporting demand for biological and organic agricultural inputs.
2. Biostimulants
Biostimulants are gaining importance as farmers seek better crop productivity and resilience.
3. Soil Health
Long-term soil degradation is increasing demand for biological and organic solutions.
4. Export Opportunity
The company already has a presence across 32+ countries, giving it a platform to expand international revenue.
5. Precision Agriculture
Increasing adoption of scientific crop management creates opportunities for specialised crop-care products.
Key Growth Drivers
Biologicals
Biological crop protection and bio-fertilisers could become an increasingly important growth engine.
Biostimulants
New product launches and growing farmer awareness can increase penetration.
International Expansion
The company has an established international footprint and continues to participate in global agricultural markets.
Product Innovation
The company’s R&D capabilities allow it to develop specialised crop solutions.
Sustainable Farming
The company’s positioning around environmentally friendly agriculture aligns with long-term global trends.
Key Risks
1. Agricultural Cyclicality
Revenue can be influenced by:
- Monsoon
- Crop prices
- Farmer income
- Pest outbreaks
- Government policies
2. Commodity/Input Costs
Raw-material inflation can affect margins.
3. Working Capital
The increase in inventory and receivables during FY2026 requires monitoring.
4. Competition
The company competes with large domestic and multinational agricultural-input companies.
5. Regulatory Risk
Agricultural chemicals, biologicals, fertilizers and crop-protection products are subject to regulatory approvals.
6. Unlisted Liquidity
The shares are not listed on NSE/BSE. Investors may have difficulty finding buyers or sellers at the desired price.
7. Valuation Risk
Although the company is not expensive compared with many unlisted opportunities, the share price has already appreciated significantly from the lower end of its recent range.
Current Unlisted Share Price
There is no exchange-traded price because T. Stanes is unlisted.
Current market references show a significant range.
Planify
Approximately:
₹821.50/share
as of 10 September 2026.
52-week range reported:
₹821 – ₹960
Neoma Capital
Approximately:
₹815.76/share
as of 10 September 2026.
Moneycontrol
Moneycontrol currently displays approximately:
₹941.50/share
with a 52-week high of ₹989 and low of ₹810.
Important
These are indicative unlisted-market references, not NSE/BSE prices.
Actual transaction prices can differ based on:
- Quantity
- Seller availability
- Buyer demand
- Lot size
- Intermediary
- Settlement terms
Market Capitalisation
With:
23,66,184 shares
at ₹821.50:
Market Capitalisation ≈ ₹194.4 Cr
At ₹941.50:
Market Capitalisation ≈ ₹222.8 Cr
This difference is important when assessing valuation.
Valuation
At ₹821.50/share
Market cap:
~₹194.4 Cr
FY2026 PAT:
₹25.42 Cr
Approximate P/E:
~7.65x
At ₹941.50/share
Market cap:
~₹222.8 Cr
Approximate P/E:
~8.77x
The company’s FY2026 EPS is reported at approximately:
₹107.44
Price-to-Book
FY2026 equity attributable to the company is approximately:
₹240.70 Cr
With 23.66 lakh shares, the implied book value is approximately:
₹1,017/share
Therefore:
At ₹821.50 → P/B ≈ 0.81x
At ₹941.50 → P/B ≈ 0.93x
This means the company is currently trading below its FY2026 book value based on the consolidated equity attributable to owners.
That is one of the most interesting aspects of the valuation.
Enterprise Value Perspective
The company has almost no conventional debt.
At ₹821.50/share:
Market capitalisation:
~₹194 Cr
The company also holds:
₹74.52 Cr investments
plus:
₹12.45 Cr cash
and:
₹4.20 Cr other bank balances.
Therefore, the balance sheet provides substantial support to the equity valuation.
However, investors should not simply subtract the entire investment portfolio from market cap because some investments may be strategic/non-liquid and because operating working capital is required to run the business.
Illustrative Valuation Range
Using FY2026 EPS of approximately ₹107.44:
| P/E Multiple | Indicative Value |
|---|---|
| 7x | ₹752 |
| 8x | ₹860 |
| 10x | ₹1,074 |
| 12x | ₹1,289 |
| 15x | ₹1,612 |
This is not a target price. It is simply a sensitivity analysis showing how the valuation changes with earnings multiples.
At ₹820–₹825, the company is effectively being valued around 7.6–7.7x FY2026 earnings.
Why the Valuation Looks Interesting
There are four important factors.
1. P/E below 10x
At around ₹820–₹825, the company trades at less than 8x FY2026 earnings.
2. Below Book Value
The price is below the approximate FY2026 book value per share.
3. Very Low Debt
Borrowings are negligible.
4. Strong Cash Generation
FY2026 operating cash flow was ₹17.75 Cr.
This combination is relatively uncommon in the unlisted market.
What Could Re-rate the Company?
Potential catalysts include:
Higher Growth
If revenue growth accelerates from the current low-single-digit rate, earnings could compound faster.
Higher Biologicals Mix
A greater contribution from higher-value biological and biostimulant products could improve margins.
International Expansion
Greater exports could increase revenue diversification.
Improved Working Capital
Better receivable collection and inventory management could increase free cash flow.
IPO / Listing
There is currently no confirmed IPO announcement identified in the sources reviewed.
Therefore, investors should not buy the shares solely on the assumption that the company will list.
Investment Positives
Strong heritage: 150+ years of business history.
Attractive sector: Agriculture and sustainable crop-care products.
International footprint: 32+ countries.
Low leverage: Almost zero conventional borrowings.
Positive cash flow: ₹17.75 Cr operating cash flow in FY2026.
Strong investment portfolio: ₹74.52 Cr.
Below-book valuation: At around ₹820, price/book is below 1x.
Reasonable P/E: Approximately 7.6x FY2026 earnings at ₹821.50.
Dividend history: ₹19.50/share declared for FY2025.
Investment Risks
Moderate revenue growth: FY2026 revenue grew only ~3.7%.
Low margins: Net margin is around 4.5–4.6%.
Working-capital intensity: Inventory and receivables increased.
Agricultural dependence: Weather and farmer economics can affect demand.
Regulatory exposure: Crop-care products require regulatory compliance.
Unlisted liquidity: Exit may take time.
Price dispersion: Different intermediaries quote substantially different prices.
Overall Assessment
| Parameter | Assessment |
|---|---|
| Business Quality | ★★★★☆ |
| Industry Opportunity | ★★★★☆ |
| Revenue Growth | ★★★☆☆ |
| Profitability | ★★★☆☆ |
| Balance Sheet | ★★★★★ |
| Debt Position | ★★★★★ |
| Cash Generation | ★★★★☆ |
| Valuation at ~₹820 | ★★★★☆ |
| Dividend Track Record | ★★★★☆ |
| Unlisted Liquidity | ★★☆☆☆ |
Final Investment View
T. Stanes is one of the more interesting value-oriented unlisted agricultural businesses because it combines several attractive characteristics:
Long operating history + established agricultural brand + biological/organic product portfolio + international presence + very low debt + investment assets + positive cash generation.
The biggest attraction at the current indicative price around ₹820–₹825 is valuation.
At approximately ₹821.50:
- Market cap: ~₹194 Cr
- FY2026 PAT: ₹25.42 Cr
- P/E: ~7.6x
- Approximate book value: ~₹1,017/share
- P/B: ~0.81x
- Investments: ₹74.52 Cr
- Cash & bank balances: ~₹16.65 Cr
- Borrowings: ~₹0.01 Cr
The business, however, is not a high-growth story at present. FY2026 revenue growth was only around 3.7%, while ROE and ROCE declined from the previous year. Working capital also absorbed more cash through higher inventory and receivables.
My overall view:
T. Stanes appears fundamentally stronger than its current low-single-digit revenue growth might suggest, and at around ₹820 the valuation provides a reasonable margin of safety.
The most interesting part is not just the P/E of ~7.6x, but the combination of:
<10x earnings + below book value + negligible debt + substantial investments + positive operating cash flow.
For a long-term investor, the key question is whether T. Stanes can accelerate growth through biologicals, biostimulants, sustainable agriculture and international markets while maintaining its strong balance sheet.
At prices closer to ₹940–₹960, the margin of safety becomes less compelling, although the company can still justify a premium if earnings growth accelerates.
Important Links
Official Company Website:
T. Stanes and Company Limited
Company Overview / History:
T. Stanes – Company Overview
Official Investor Relations & Annual Reports:
T. Stanes – Investor Relations
FY2024-25 Official Annual Report:
T. Stanes Annual Report FY2024-25
Domestic Crop Care Products:
T. Stanes – Domestic Crop Care
International Crop Care:
T. Stanes – International Crop Care
Current Unlisted Price Reference – Planify:
T. Stanes Unlisted Shares – Planify
Current Unlisted Price Reference – Neoma Capital:
T. Stanes Unlisted Shares – Neoma Capital
Financials / Annual Reports – WWIPL:
T. Stanes Financials & Annual Reports
Disclaimer
This report is prepared for informational and research purposes only and should not be construed as investment advice, an offer to buy or sell securities, or a guarantee of future returns.
T. Stanes and Company Limited is an unlisted company. Its shares do not trade on NSE/BSE and therefore market prices quoted by different intermediaries may vary significantly. Investors should verify the actual executable price, quantity, settlement terms and availability before entering into any transaction.
Financial information should be independently verified against the latest audited financial statements and corporate filings. Investors should also conduct their own due diligence regarding shareholding, related-party transactions, taxation, liquidity, corporate actions and potential listing plans.
For more such unlisted stocks visit https://unlistedcart.com/unlisted-shares/