Company: Resins & Plastics Limited
CIN: U25209MH1961PLC012223
ISIN: INE422F01017
Face Value: ₹10 per share
Incorporated: 22 December 1961
Operations: Since 1971
Registered Office: Andheri East, Mumbai, Maharashtra
Industry: Specialty Chemicals / Synthetic Resins
Status: Unlisted Public Company
Promoter Holding: 88.62% as of 31 March 2026
Shares Outstanding: 41.72 lakh
Executive Summary
Resins & Plastics Limited (RPL) is a long-established Indian manufacturer of synthetic resins, supplying critical intermediate materials to industries such as paints and coatings, adhesives, construction chemicals, printing inks, automotive coatings, industrial coatings and other specialty applications.
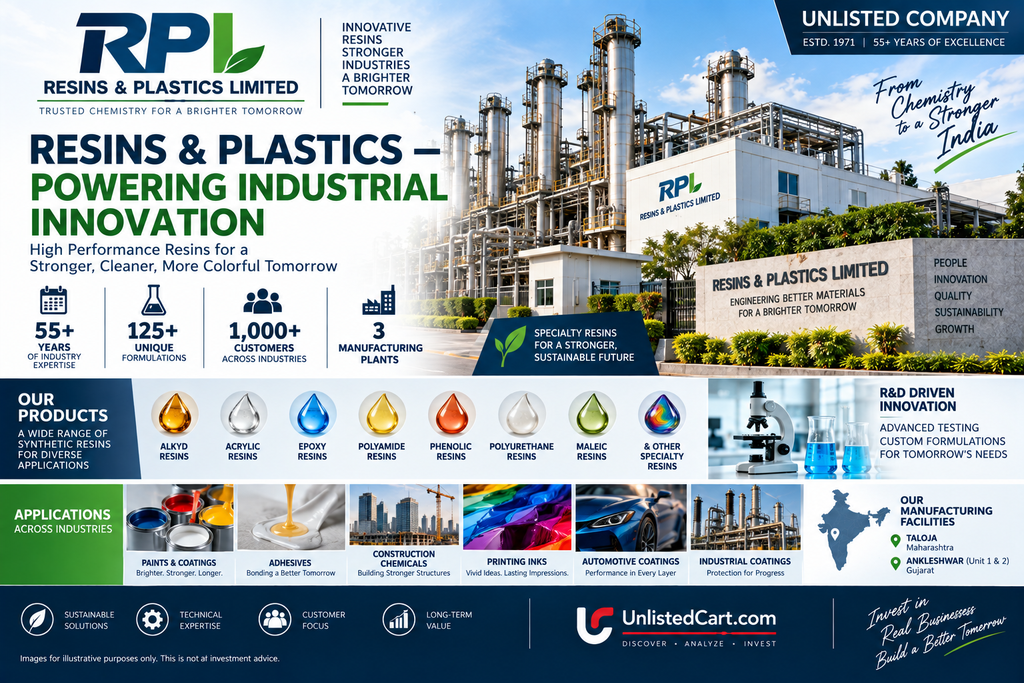
The company states that it has 55+ years of industry experience, 125+ unique formulations, 1,000+ customers and 150+ active SKUs, supported by manufacturing facilities in Maharashtra and Gujarat and a distribution network spanning India and international markets.
The company’s FY2025-26 performance was significantly stronger than FY2024-25:
- Revenue from operations: ₹331.48 Cr
- Revenue growth: 12.3%
- EBITDA: approximately ₹30.5 Cr
- EBITDA margin: approximately 9.2%
- PBT: ₹28.74 Cr
- PAT: ₹21.37 Cr
- EPS: ₹51.21
- ROE: 16.97%
- ROCE: 22.69%
- Operating cash flow: ₹9.60 Cr
- Debt-equity ratio: Not applicable / no borrowings reported
- Recommended dividend: ₹9/share
The company has therefore moved from FY25 PAT of ₹11.61 Cr to FY26 PAT of ₹21.37 Cr, an increase of approximately 84%.
At an indicative unlisted-market price around ₹673–₹675/share in September 2026, RPL’s implied market capitalisation is approximately ₹281 Cr, with an FY26 P/E of about 13.2x based on audited EPS of ₹51.21.
The investment case is therefore primarily about earnings growth, specialty-resin positioning, high promoter ownership, debt-light balance sheet and potential operating leverage, balanced against unlisted liquidity, working-capital requirements, raw-material sensitivity and the relatively concentrated ownership structure.
1. Company Overview
Resins & Plastics Limited is an Indian specialty-chemical manufacturer with roots going back to the early 1960s.
The company’s current website describes RPL as a leader in synthetic resins with more than five decades of experience. Its operations serve a wide range of industries, with manufacturing infrastructure and R&D capabilities focused on developing resin technologies for different applications.
Official Company Website:
Resins & Plastics Official Website
Official Investor Relations:
RPL Investor Relations & Annual Reports
2. History
RPL’s operations began in 1971 with the manufacturing of synthetic resins.
Over the decades, the company expanded its product portfolio and manufacturing footprint.
The company’s official history highlights:
- 1971: First production facility at Taloja, Maharashtra
- 1985: Second manufacturing facility at Ankleshwar, Gujarat
- 1995: Third manufacturing facility at Ankleshwar
- 2002: ISO 9001 certification
- 2016: Taloja expansion
- 2019: Ankleshwar Unit-1 expansion
- 2022: Integrated Management System certification
The company therefore has a considerably longer operating history than many privately held specialty-chemical businesses currently available in the unlisted market.
3. Business Model
RPL operates primarily as a B2B specialty-chemical manufacturer.
The company sells resin products to industrial customers rather than directly to consumers.
Its products act as important inputs into the formulation of coatings, adhesives, inks and other industrial products.
Major product categories
RPL’s product portfolio includes:
- Alkyd Resins
- Acrylic Resins
- Epoxy Resins
- Polyamide Resins
- Phenolic Resins
- Polyurethane Resins
- Maleic Resins
- Polyester Resins
- Ketonic Resins
- Amino Resins
- Other specialty formulations
The FY2025-26 annual report specifically describes Alkyd, Acrylic, Polyamide, Phenolic, Polyurethane and Maleic resins within the company’s portfolio.
4. End-Market Applications
RPL’s resins are used across multiple industrial applications.
Paints & Coatings
Resins are essential binding materials in paint and coating formulations.
Applications include:
- Automotive coatings
- Industrial coatings
- Protective coatings
- Can coatings
- Floor coatings
- Wood finishes
- Marine coatings
Adhesives
Specialty resin systems are used in adhesive formulations for industrial and construction applications.
Construction Chemicals
RPL develops resin systems used in flooring, grouting, protective coatings and other construction applications.
Printing Inks
Synthetic resins provide important properties such as adhesion, gloss, durability and drying characteristics.
Electrical & Industrial Applications
Certain resin formulations are used in insulating varnishes, wire enamels and industrial applications.
The company’s product and R&D pages highlight applications across coatings, adhesives, construction chemicals, printing inks, automotive coatings and other specialty uses.
5. Manufacturing Footprint
RPL’s FY2025-26 annual report identifies three manufacturing plants:
1. Taloja, Maharashtra
2. Ankleshwar, Gujarat – Unit 1
3. Ankleshwar, Gujarat – Unit 2
The plants are located close to important industrial and logistics corridors, with the company’s historical disclosures noting the proximity of the Gujarat and Maharashtra facilities to shipping ports.
The company’s current website describes its facilities as advanced manufacturing operations designed for high-volume, precision production and scalability.
6. Research & Development
R&D is an important part of RPL’s business model because specialty-resin customers often require customised formulations.
The company operates an R&D centre recognised by the Government of India’s Department of Science & Technology.
Its current R&D infrastructure includes:
- Glass-lined reactors
- FTIR spectrophotometers
- Gas chromatographs
- Viscometers
- QUV weathering testers
- Salt-spray chambers
- Spray booths
- Automatic film applicators
- Curing ovens
These facilities allow RPL to test properties such as:
- Gloss
- Hardness
- Adhesion
- Durability
- Weathering
- Corrosion resistance
This technical capability can be important in retaining customers because resin formulations frequently need to meet application-specific performance requirements.
7. Customer & Distribution Network
RPL’s current website states that it serves 1,000+ customers and has a distribution presence across India and the Indian subcontinent/MEA region.
The company’s distributor network currently extends to markets including:
- India
- Bangladesh
- UAE
- UK
- Africa
- South America
This gives RPL a combination of:
Manufacturing + R&D + Technical Support + Distribution
rather than functioning purely as a commodity chemical producer.
8. Export Business
Exports remain a relatively small but growing part of the business.
FY2025-26 sales disclosed in the annual report were:
| Market | FY26 |
|---|---|
| Home Market | ₹321.45 Cr |
| Export Market | ₹9.02 Cr |
| Total | ₹330.47 Cr |
Exports therefore represented approximately 2.7% of net resin sales in FY26.
The company has indicated ambitions to expand its international presence, particularly across the Indian subcontinent and Middle East/Africa markets.
9. FY2025-26 Financial Performance
The latest audited annual report shows a substantial improvement in profitability.
Financial Performance
| ₹ Crore | FY22 | FY23 | FY24 | FY25 | FY26 |
|---|---|---|---|---|---|
| Revenue from Operations | 213.76 | 252.25 | 258.21 | 295.05 | 331.48 |
| Total Income | 215.65 | 253.19 | 260.52 | 297.20 | 333.32 |
| PBT | 15.88 | 13.30 | 15.55 | 15.61 | 28.74 |
| PAT | 11.82 | 9.81 | 11.58 | 11.61 | 21.37 |
| EPS | 28.32 | — | — | 27.82 | 51.21 |
FY26 Growth
Revenue increased:
₹295.05 Cr → ₹331.48 Cr
Growth: approximately 12.3%
PAT increased:
₹11.61 Cr → ₹21.37 Cr
Growth: approximately 84%
This shows that FY26’s profit growth was substantially faster than revenue growth.
10. Margin Analysis
The annual report reports operating profit as a percentage of sales at:
FY25: 4.56%
FY26: 8.11%
This is a significant improvement.
The company’s reported FY26 PBT margin on total income was approximately:
₹28.74 Cr ÷ ₹333.32 Cr = 8.6%
PAT margin:
₹21.37 Cr ÷ ₹333.32 Cr = 6.4%
The improvement suggests better operating leverage and/or product mix and cost economics in FY26.
11. Long-Term Earnings Trend
Using the company’s five-year summary:
Revenue increased from approximately:
₹213.76 Cr in FY22 → ₹331.48 Cr in FY26
This represents an approximate 11.6% CAGR.
PAT increased from:
₹11.82 Cr → ₹21.37 Cr
This represents an approximate 16% CAGR over the same period.
The faster PAT growth compared with revenue indicates that profitability has improved over the period, although annual fluctuations have occurred.
12. Balance Sheet
RPL reported the following broad balance-sheet position at 31 March 2026:
| Particular | FY26 |
|---|---|
| Net Fixed Assets | ₹21.41 Cr |
| Investments | ₹0.01 Cr |
| Long-Term Loans & Advances | ₹1.18 Cr |
| Net Current Assets | ₹113.53 Cr |
| Share Capital | ₹4.17 Cr |
| Reserves | ₹130.96 Cr |
| Total Net Worth | ~₹136.12 Cr |
The company has therefore accumulated a sizeable reserve base relative to its paid-up equity capital.
13. Debt Position
One of the attractive balance-sheet characteristics is the company’s very low financing burden.
The FY2025-26 annual report reports:
Debt-equity ratio: NA
and states that there were no outstanding term loans at the beginning of the year and no term loan was taken during FY26. Finance cost was only ₹0.09 Cr in the FY26 profit-and-loss statement.
This means the business is not currently dependent on significant interest-bearing debt for operations.
However, investors should distinguish between zero/low debt and zero working-capital financing, because the company does use a cash-credit facility and has significant receivables.
14. Working Capital
This is one of the areas requiring closer monitoring.
As of 31 March 2026:
Trade receivables: ₹89.08 Cr
Inventory: ₹28.82 Cr
Cash & bank balances: ₹0.59 Cr
Short-term loans & advances: ₹4.79 Cr
Trade receivables increased from:
₹72.71 Cr → ₹89.08 Cr
This increase is faster than the increase in revenue.
The company’s trade-receivables turnover ratio also declined from:
4.50x → 4.09x
This indicates that working-capital efficiency should remain an important monitoring point.
15. Cash Flow
FY26 operating cash flow improved substantially.
| Cash Flow | FY25 | FY26 |
|---|---|---|
| Operating Cash Flow | -₹8.64 Cr | ₹9.60 Cr |
| Investing Cash Flow | ₹10.17 Cr | -₹7.16 Cr |
| Financing Cash Flow | -₹2.94 Cr | -₹2.95 Cr |
The improvement in operating cash flow is encouraging.
However, operating cash flow of ₹9.60 Cr was still below PAT of ₹21.37 Cr because working capital absorbed cash, particularly through higher trade receivables.
This is an important distinction:
Accounting profitability improved sharply, but cash conversion still needs to improve further.
16. Capital Expenditure
FY26 investing cash flow included:
- Property, plant & equipment capex: ₹4.13 Cr
- Capital work-in-progress: ₹3.14 Cr
Total identified capital investment was therefore approximately ₹7.27 Cr.
This indicates that the company continues to invest in manufacturing capacity and infrastructure.
17. Dividend
The Board recommended a dividend of:
₹9 per share
for FY2025-26, subject to shareholder approval.
At an indicative share price of ₹675, the proposed dividend represents an approximate:
Dividend Yield = 1.33%
This is not the primary investment thesis, but it indicates that a portion of earnings is being returned to shareholders.
18. Shareholding Pattern
As of 31 March 2026:
| Category | Shares | Holding |
|---|---|---|
| Promoters | 36,97,863 | 88.62% |
| Public | 4,74,437 | 11.38% |
| Total | 41,72,300 | 100% |
The promoter holding is therefore very high.
This can provide alignment with long-term business performance, but it also means that the freely available share base is relatively small.
For an unlisted company, this can materially affect liquidity and price discovery.
19. Strategic Corporate Development – Pragati Chemicals
An important historical development is the amalgamation of Pragati Chemicals Limited into Resins & Plastics Limited.
The scheme was designed to consolidate businesses, simplify the corporate structure, reduce duplication and improve operational and financial coordination.
This is relevant because Pragati Chemicals had expertise in products including amino, ketonic and epoxy resins.
The consolidation therefore provides additional context for understanding RPL’s broader resin portfolio.
20. Industry Opportunity
RPL participates in several industries with long-term demand drivers.
Paints & Coatings
Growth in housing, infrastructure, automotive production and industrial activity supports demand for coatings and consequently resin inputs.
Construction Chemicals
Increasing construction activity creates demand for specialised flooring, waterproofing, grouting and protective-coating products.
Automotive
Automotive coatings require increasingly specialised resin systems with requirements around durability, gloss, corrosion resistance and environmental performance.
Industrial Manufacturing
Machinery, electrical equipment, infrastructure and engineering industries require industrial coatings and adhesives.
Printing & Packaging
Printing inks remain an important application for specialty resin systems.
Export Opportunity
RPL’s current distribution footprint across South Asia and MEA provides a platform for further international expansion.
21. Competitive Advantages
1. Long Operating History
RPL has been operating for more than five decades.
2. Technical Expertise
The company has an established R&D operation and more than 125 formulations according to its current website.
3. Customer Relationships
The company states that it serves more than 1,000 customers.
4. Product Diversification
RPL has multiple resin families rather than depending on a single chemistry.
5. Manufacturing Locations
Its facilities in Taloja and Ankleshwar provide access to major industrial and logistics ecosystems.
6. High Promoter Ownership
Promoters held 88.62% as of March 2026.
7. Low Financial Leverage
The company reports no meaningful term-loan burden and very low finance costs.
22. Sustainability & ESG
RPL has increasingly incorporated sustainability into its operations.
The company states that its Taloja plant operates as a Zero Liquid Discharge (ZLD) facility and that it has moved to natural-gas-based heating to reduce emissions.
It also reports environmental monitoring and sustainability initiatives across its operations.
The company is also a member of the UN Global Compact Network, India.
23. Current Unlisted Share Price
Current September 2026 secondary-market references show prices around:
₹673–₹675 per share
Planify reported ₹672.90 on 15 September 2026, while UnlistedZone reported ₹675 on 14 September 2026.
These are indicative OTC/unlisted-market prices, not NSE/BSE traded prices.
Current reference range
₹670–₹675/share
This range should be independently reconfirmed with the intermediary before any transaction because unlisted prices can vary significantly between buyers and sellers.
24. Market Capitalisation
Shares outstanding:
41.72 lakh
At ₹675/share:
41.72 lakh × ₹675 ≈ ₹281.4 Cr
Therefore, the current indicative market capitalisation is approximately:
₹280–282 Cr
This is broadly consistent with current secondary-market references.
25. Valuation
FY26 audited EPS:
₹51.21
At ₹675/share:
P/E = ₹675 ÷ ₹51.21 ≈ 13.2x
Therefore, RPL is currently trading around:
13.2x FY26 earnings
Price-to-Book
FY26 net worth is approximately ₹136.12 Cr.
With 41.72 lakh shares:
Book value ≈ ₹326/share
At ₹675:
P/B ≈ 2.07x
Therefore, the current indicative valuation is approximately:
13.2x P/E + 2.1x P/B
26. Valuation Sensitivity
Using FY26 EPS of ₹51.21:
| P/E Multiple | Implied Price |
|---|---|
| 8x | ₹410 |
| 10x | ₹512 |
| 12x | ₹615 |
| 13x | ₹666 |
| 14x | ₹717 |
| 16x | ₹819 |
| 18x | ₹922 |
| 20x | ₹1,024 |
| 22x | ₹1,127 |
These are illustrative valuation calculations and not price targets or forecasts.
At the current indicative price around ₹675, the valuation is approximately equivalent to 13.2x FY26 EPS.
27. Earnings Scenario Analysis
To understand valuation sensitivity, assume FY27 EPS were hypothetically:
| EPS Scenario | 12x | 15x | 18x |
|---|---|---|---|
| ₹45 | ₹540 | ₹675 | ₹810 |
| ₹50 | ₹600 | ₹750 | ₹900 |
| ₹55 | ₹660 | ₹825 | ₹990 |
| ₹60 | ₹720 | ₹900 | ₹1,080 |
| ₹65 | ₹780 | ₹975 | ₹1,170 |
These are mathematical scenarios rather than management guidance or earnings forecasts.
They demonstrate that the future valuation will depend on both:
EPS growth + sustainable valuation multiple
28. Key Risks
1. Unlisted Liquidity
There is no active NSE/BSE market for the shares.
This creates:
- Limited buyers
- Limited sellers
- Wide bid/ask spreads
- Potentially long exit periods
- Less transparent price discovery
2. Working Capital
Trade receivables of ₹89.08 Cr are substantial relative to annual revenue.
The receivables turnover ratio declined from 4.50x to 4.09x.
3. Raw Material Costs
Synthetic-resin manufacturing is exposed to fluctuations in petrochemical and other chemical feedstock prices.
Margin expansion can therefore reverse if input costs rise faster than selling prices.
4. Customer Concentration
Specialty chemical manufacturers can become dependent on relationships with major industrial customers.
Loss of a large customer or pressure on pricing can affect profitability.
5. High Promoter Ownership
88.62% promoter ownership leaves a relatively small public float.
This can contribute to low liquidity and potentially large differences between quoted buying and selling prices.
6. Export Concentration
Exports are still a relatively small proportion of total sales.
International expansion therefore represents an opportunity, but execution and customer acquisition will be important.
7. Valuation Depends on FY26 Earnings
The stock’s current valuation looks much more reasonable after the FY26 earnings improvement.
However, investors should determine whether FY26’s margin improvement is sustainable rather than simply annualising one strong year.
29. IPO / Listing Status
RPL is currently treated as an unlisted public company in current company and market databases.
Current secondary-market sources indicate:
DRHP filed: No
There is no verified IPO timeline available from the company’s official investor-relations disclosures.
Therefore, investors should not build the investment thesis purely around a potential IPO.
The core valuation should instead be based on:
Earnings + Cash Flow + Balance Sheet + Growth + Liquidity
30. What Could Drive Future Growth?
1. Specialty Resin Expansion
Higher-value formulations could improve product mix and margins.
2. New Product Development
The company has recently highlighted products such as:
- Polyester Resin
- Cycloaliphatic Amine Hardener
- Reactive Diluent
3. Export Expansion
The existing distributor footprint provides a platform for expansion across South Asia, Middle East and Africa.
4. Coatings Industry Growth
Increasing automotive, industrial and infrastructure activity can support resin demand.
5. Operating Leverage
If revenue continues growing faster than fixed costs, the company could potentially sustain higher margins.
6. R&D-led Customisation
Custom formulations can improve customer stickiness and reduce direct commodity competition.
31. Key Numbers at a Glance
| Metric | FY2025-26 |
|---|---|
| Revenue | ₹331.48 Cr |
| Revenue Growth | 12.3% |
| PBT | ₹28.74 Cr |
| PAT | ₹21.37 Cr |
| PAT Growth | ~84% |
| EPS | ₹51.21 |
| ROE | 16.97% |
| ROCE | 22.69% |
| Operating Cash Flow | ₹9.60 Cr |
| Trade Receivables | ₹89.08 Cr |
| Inventory | ₹28.82 Cr |
| Net Worth | ~₹136.12 Cr |
| Promoter Holding | 88.62% |
| Indicative Price | ₹670–675 |
| Approx. Market Cap | ₹280–282 Cr |
| FY26 P/E | ~13.2x |
| Approx. P/B | ~2.1x |
| FY26 Proposed Dividend | ₹9/share |
32. Investment Perspective
Resins & Plastics is an interesting example of a small, profitable, debt-light specialty-chemical business in the unlisted market.
The FY26 numbers are particularly important because the company achieved:
₹331 Cr+ revenue + ₹21 Cr+ PAT + 16.97% ROE + 22.69% ROCE
while maintaining a very low financing burden.
The strongest part of the current financial story is the improvement in profitability.
However, the key due-diligence question is whether the FY26 margin improvement can be sustained.
The other major issue is cash conversion: operating cash flow of ₹9.60 Cr remained materially below PAT because higher receivables absorbed working capital.
At approximately ₹675/share, the stock is valued at around 13.2x FY26 earnings.
That valuation needs to be assessed against:
- Future earnings growth
- Sustainability of FY26 margins
- Working-capital efficiency
- Specialty-product mix
- Export expansion
- Unlisted liquidity
33. Overall Assessment
RPL has several identifiable strengths:
Long operating history
Specialty-resin expertise
125+ formulations / 150+ active SKUs
1,000+ customers
Three manufacturing facilities
Strong promoter ownership
Low financial leverage
Positive operating cash flow
Improved FY26 profitability
Growing R&D/product pipeline
At the same time, investors should carefully monitor:
Receivables growth
Raw-material price volatility
Margin sustainability
Low public float
Unlisted-market liquidity
Limited price discovery
Dependence on continued earnings growth
At the current indicative valuation around ₹675, RPL is not being valued solely on a speculative IPO expectation; the valuation can be analysed against its actual FY26 earnings.
The central investment question is therefore:
Can RPL sustain the FY26 earnings improvement and convert revenue growth into stronger cash generation over the next few years?
That question should be answered through quarterly/annual financial performance, receivable trends, margins, new-product contribution and export growth.
34. Important Links
Company Website:
Resins & Plastics Limited
Official Investor Relations:
Investor Relations – Resins & Plastics
Official FY2025-26 Annual Report:
RPL Annual Report 2025-26
Official R&D Information:
Resins & Plastics R&D
Current Indicative Unlisted Price:
Resins & Plastics – Planify Market Reference
Additional Market Reference:
Resins & Plastics – UnlistedZone
Disclaimer
This report is prepared strictly for research and informational purposes and should not be considered investment advice, a recommendation, an offer or solicitation to buy or sell securities.
Resins & Plastics Limited is an unlisted company and its shares have limited liquidity and price discovery. Indicative unlisted-market prices can vary significantly between buyers and sellers and should be independently verified before any transaction.
Financial figures in this report are primarily based on the company’s FY2025-26 audited annual report. Valuation sensitivity calculations are illustrative and are not price targets, forecasts or guarantees of future returns.
Investors should independently verify the latest financial statements, shareholding, transaction price, transferability, tax implications and applicable regulatory requirements before investing.
For more such unlisted stocks visit https://unlistedcart.com/unlisted-shares/