CIN: U27209MH2017PLC300388
ISIN: INE0UWB01010
Face Value: ₹10 per share
Incorporated: 4 October 2017
Registered Office: MIDC Waluj, Gangapur, Aurangabad, Maharashtra
Status: Active Unlisted Public Company
Industry: Industrial Fasteners / Precision Engineering / Auto Components
Executive Summary
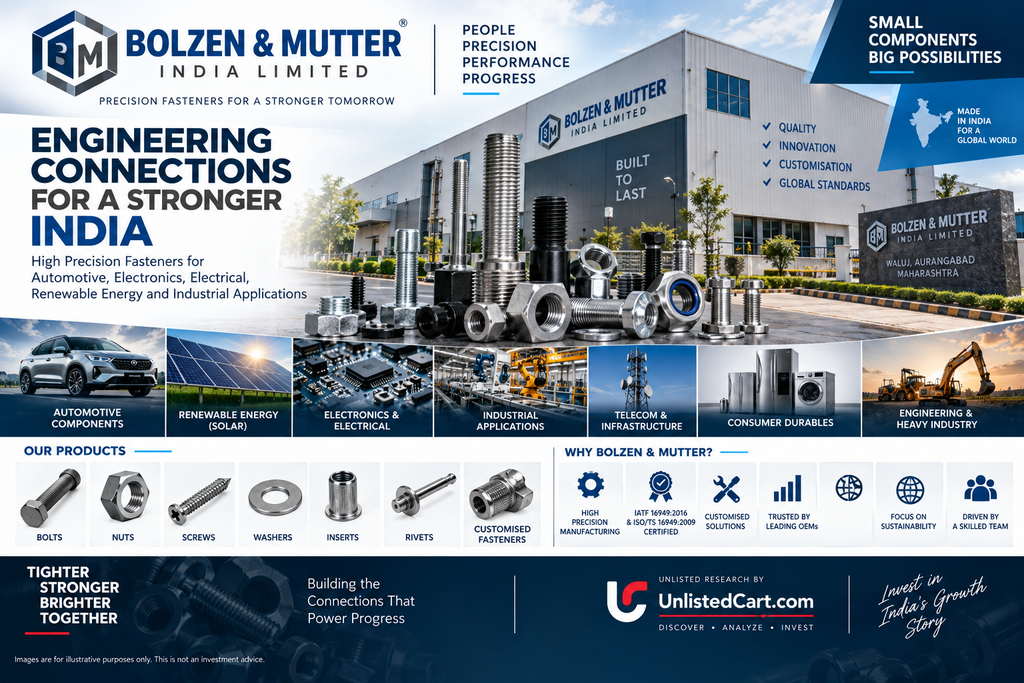
Bolzen & Mutter Limited is a Maharashtra-based precision fastener manufacturer established in 2017. The company manufactures specialised bolts, nuts and other fastening products for applications across the automobile, electronics, electrical and renewable-energy sectors.
The company operates from a roughly 25,000 sq. ft. manufacturing facility in Waluj Industrial Area, Aurangabad, and focuses on customised and high-precision fasteners. Its official website highlights IATF 16949:2016 and ISO/TS 16949:2009 quality-system compliance.
The financial growth has been extremely strong:
- FY23 revenue: ₹18.56 Cr
- FY24 revenue: ₹36.54 Cr
- FY25 revenue: ₹78.57 Cr
- FY25 EBITDA: ₹6.15 Cr
- FY25 PAT: ₹3.65 Cr
- FY25 EPS: ₹14.93
- FY25 net worth: approximately ₹8.48 Cr
- FY25 borrowings: approximately ₹19.12 Cr
FY25 revenue more than doubled year-on-year, but the operating margin moderated from FY24. At the same time, borrowings increased substantially to support expansion and working capital.
As of September 2026, various unlisted-market platforms indicate a price around ₹381–₹400 per share, implying a market capitalisation of roughly ₹93–98 Cr. However, these are OTC/unlisted indicative prices and not exchange-traded quotes.
At approximately ₹381, the stock is valued at around 25–26x FY25 earnings, which means the market is already pricing in significant future growth.
Company Overview
Bolzen & Mutter was established in 2017 and is headquartered in Aurangabad, Maharashtra.
The company specialises in manufacturing precision fasteners, including:
- Special bolts
- Nuts
- Screws
- Inserts
- Rivets
- Washers
- Customised industrial fasteners
- Automobile fasteners
- Renewable-energy/solar fasteners
The company describes its focus as providing high-quality and high-precision fastening solutions for automobile, electronics, electrical and solar-related applications.
Its manufacturing facility is located in the Waluj Industrial Area near Aurangabad, an important automotive and engineering manufacturing cluster.
Business Model
Bolzen & Mutter operates primarily as a B2B industrial component manufacturer.
Its business model is based on:
- Designing and manufacturing specialised fasteners.
- Supplying OEMs and Tier-1/Tier-2 suppliers.
- Developing customised components according to customer drawings and specifications.
- Serving multiple industrial sectors.
- Expanding into renewable-energy applications, particularly solar.
The customised nature of the products can create higher customer stickiness compared with purely commodity-standard fasteners.
The company also highlights its ability to manufacture products according to specific customer requirements.
Key Customers / Business Relationships
Historical industry coverage has referenced customers/business relationships including:
- Varroc Engineering
- Rucha Engineering
- Minda Corporation
- Daebu Auto
- Seat India
- Prabha Engineering
- TKE Components
- Airtel
- Sun TV
- Tata Sky
- Dish TV / D2H
- PME Auto Electrical
The company has also highlighted qualification through a Volkswagen-related VDA 6.3 audit via Rucha Engineering.
These relationships indicate that Bolzen & Mutter has exposure beyond traditional commodity fasteners.
Important: customer references should not automatically be interpreted as current active orders or guaranteed future revenue. Investors should verify current customer concentration and order books from the latest company disclosures.
Industry Opportunity
1. Automotive
Fasteners are essential components in automobiles and commercial vehicles.
India’s growth in:
- Passenger vehicles
- Commercial vehicles
- Two-wheelers
- EVs
- Auto-component exports
creates a structural opportunity for precision fastener manufacturers.
2. Renewable Energy
This is one of the more interesting potential growth areas for Bolzen & Mutter.
Solar projects require large quantities of specialised fastening products for:
- Solar module mounting
- Structures
- Frames
- Electrical installations
- Support systems
Management has historically highlighted the potential of the solar segment and its intention to increase exposure to renewable-energy applications.
3. Import Substitution
India’s push towards domestic manufacturing creates an opportunity for local suppliers that can meet international quality standards.
For specialised fasteners, customers generally value:
- Quality consistency
- Traceability
- Delivery reliability
- Customisation
- Certification
- Cost competitiveness
Manufacturing & Quality
Bolzen & Mutter states that its manufacturing processes are designed for high precision and customised requirements.
The company highlights compliance with:
IATF 16949:2016
and
ISO/TS 16949:2009
These standards are particularly relevant to automotive supply chains.
The company also highlights modern manufacturing and design processes and strict quality control.
Financial Performance
Revenue & Profit
| ₹ Crore | FY23 | FY24 | FY25 |
|---|---|---|---|
| Revenue | 18.56 | 36.54 | 78.57 |
| EBITDA | 1.38 | 4.93 | 6.15 |
| PBT | 0.33 | 3.23 | 4.98 |
| PAT | 0.35 | 2.24 | 3.65 |
| EPS | ₹1.50 | ₹9.15 | ₹14.93 |
| EBITDA Margin | 7.44% | 13.49% | 7.83% |
| PAT Margin | 1.89% | 6.13% | 4.65% |
FY25 figures are based on the company’s audited financial statements as reproduced by unlisted-market financial databases.
Revenue Growth
Revenue increased from:
₹18.56 Cr → ₹36.54 Cr → ₹78.57 Cr
between FY23 and FY25.
That represents exceptional growth.
However, investors should not extrapolate the same growth rate indefinitely.
The key question now is whether the company can convert this rapid revenue expansion into:
- Higher EBITDA
- Higher PAT
- Stronger operating cash flow
- Lower leverage
Margin Analysis
One of the most important observations is that FY25 revenue growth was much faster than EBITDA growth.
FY24 EBITDA:
₹4.93 Cr
FY25 EBITDA:
₹6.15 Cr
Therefore, EBITDA increased approximately 25%, while revenue increased more than 100%.
Consequently, EBITDA margin declined:
13.49% → 7.83%
This deserves close monitoring.
The reasons could include:
- Higher raw-material costs
- Capacity expansion
- Employee-cost increase
- Higher operating expenses
- Working-capital requirements
- Change in product mix
The business needs to demonstrate that FY25’s margin compression was temporary and that operating leverage can improve as the expanded capacity gets utilised.
Balance Sheet
FY25 balance-sheet figures show rapid expansion.
| Particulars | FY25 |
|---|---|
| Total Assets | ₹356.06 Cr |
| Equity / Shareholders’ Funds | ₹84.84 Cr |
| Long-Term Borrowings | ₹99.02 Cr |
| Short-Term Borrowings | ₹92.14 Cr |
| Inventory | ₹71.75 Cr |
| Trade Receivables | ₹64.30 Cr |
| Cash & Bank | ₹35.00 Cr |
| Short-Term Loans & Advances | ₹55.06 Cr |
| PPE | ₹104.53 Cr |
Major Concern: Leverage
Total borrowings were approximately:
₹191.16 Cr
against shareholders’ funds of approximately:
₹84.84 Cr
This results in debt/equity of roughly:
2.25x
The current unlisted-market databases also report debt/equity around 2.25x.
This is considerably higher than what one would normally expect from a small precision-engineering company.
Net Debt
Using FY25 cash of approximately ₹35 Cr:
Net debt ≈ ₹156 Cr
against FY25 EBITDA of approximately ₹6.15 Cr.
That makes leverage a major investment risk.
It also means the company needs strong cash-flow generation and continued earnings growth to deleverage.
Working Capital
Another important area is working capital.
FY25:
- Inventory: ₹71.75 Cr
- Receivables: ₹64.30 Cr
- Short-term advances: ₹55.06 Cr
This is a significant amount relative to FY25 revenue of ₹78.57 Cr.
The company therefore needs substantial working capital to support its rapid growth.
For investors, the key question is not only:
“How fast is revenue growing?”
but also:
“How much additional capital is required to generate every ₹1 of additional revenue?”
This will determine future return on capital.
Cash Flow
FY25 operating cash flow was approximately negative ₹0.54 Cr based on the audited cash-flow statement.
This was despite reported PAT of ₹3.65 Cr.
The principal reason was the large increase in working capital, particularly inventories, receivables and advances.
This is an important red flag, although it can occur during a high-growth phase.
The company needs to demonstrate a transition from:
Revenue growth → Working-capital consumption
towards:
Revenue growth → Operating cash generation
over the next few years.
Promoter Holding
Promoter ownership remains extremely high.
FY25 promoter shareholding was approximately:
95.25%
with Hemant Madhavrao Mirkhelkar and Sunil Panditrao Aute being the principal promoter shareholders.
High promoter ownership provides strong alignment but also means the free float is very limited.
This contributes to low liquidity in the unlisted market.
Management
Key management/directors include:
Hemant Madhavrao Mirkhelkar – Managing Director
Sunil Panditrao Aute – Whole-Time Director
The company has also reported experienced personnel in finance and management.
Current Unlisted Share Price
As of September 2026, available OTC references show significant variation:
- Neoma: approximately ₹381.15
- Planify: approximately ₹400
- Other unlisted platforms: approximately ₹385
- Moneycontrol reference: approximately ₹325.50
The 52-week range reported by some platforms is approximately ₹193–₹400.
This price variation itself demonstrates an important characteristic of unlisted shares:
There is no continuous exchange-traded price discovery.
Therefore, investors should verify the actual executable buy/sell price before making an investment decision.
Current Valuation
At ₹381.15 per share and 24,46,194 shares:
Implied market capitalisation ≈ ₹93.2 Cr
FY25 PAT:
₹3.65 Cr
Therefore:
FY25 P/E ≈ 25.5x
Book value is approximately:
₹35/share
Therefore:
P/B ≈ 10.9x
These figures broadly reconcile with current unlisted-market references.
Valuation Sensitivity
Using FY25 EPS of ₹14.93:
| P/E Multiple | Implied Value |
|---|---|
| 12x | ₹179 |
| 15x | ₹224 |
| 18x | ₹269 |
| 20x | ₹299 |
| 22x | ₹328 |
| 25x | ₹373 |
| 30x | ₹448 |
At around ₹381, the market is already assigning approximately 25–26x FY25 earnings.
Therefore, the investment thesis depends heavily on future earnings growth rather than current earnings.
What Could Justify a Higher Valuation?
A premium valuation could be justified if Bolzen & Mutter delivers:
- Sustained 20–30%+ revenue growth.
- EBITDA margin recovery towards 10–12%+.
- Strong operating cash flow.
- Reduction in debt/equity.
- Greater contribution from solar/renewable energy.
- Higher export contribution.
- Increasing share of customised/high-value fasteners.
- New OEM relationships.
- Better return on capital as capacity utilisation improves.
For example, if EPS eventually reaches ₹25 and the company receives a 20x multiple, the implied value would be approximately:
₹500/share
If EPS reaches ₹30 and receives 20x:
₹600/share
But these are scenario calculations, not price targets or forecasts.
Growth Drivers
Renewable Energy
Solar and renewable-energy projects can provide a large addressable market for specialised fastening products.
Automobile & EV
The continued growth of India’s automotive manufacturing ecosystem should support demand for engineered components.
Export Opportunity
The company has historically discussed international business opportunities and exports.
Customised Products
Specialised fasteners can provide better customer stickiness than standard commodity products.
Capacity Expansion
The rapid increase in fixed assets suggests the company has been investing heavily to support its growth.
Competitive Advantages
1. Customer Qualification
Automotive customers require stringent quality and process standards, creating entry barriers.
2. Customisation
The ability to manufacture according to customer drawings can create differentiation.
3. Automotive Cluster Location
Waluj/Aurangabad provides proximity to a large industrial and automotive ecosystem.
4. Quality Certifications
IATF/ISO credentials strengthen its positioning with automotive customers.
5. Diversification
The company is not dependent solely on automobiles and has exposure to electronics, electricals and renewable energy.
Key Risks
1. High Debt
Debt/equity of approximately 2.25x is the biggest balance-sheet concern.
2. Weak Cash Conversion
FY25 operating cash flow was negative despite profitability.
3. Margin Compression
EBITDA margin fell from 13.49% in FY24 to 7.83% in FY25.
4. Raw Material Risk
Fastener manufacturing is sensitive to steel and other metal prices.
5. Working Capital
Inventory, receivables and advances are significant relative to revenue.
6. Customer Concentration
Automotive-component manufacturers can become dependent on a relatively small number of large customers.
7. Unlisted Liquidity
The shares do not trade on a regular stock exchange, creating:
- Wider bid/ask spreads
- Lower liquidity
- Limited price discovery
- Difficulty exiting large positions
8. Valuation Risk
At around ₹381–₹400, the company is already valued at approximately 25–27x FY25 earnings.
A slowdown in earnings growth could therefore lead to valuation compression.
9. Small-Company Risk
Despite its rapid growth, the absolute scale remains small compared with established listed fastener manufacturers.
IPO / Listing Status
Bolzen & Mutter is currently an unlisted public company.
Current unlisted-market references indicate:
DRHP: Not filed
Therefore, there is currently no confirmed IPO date that should be treated as an investment catalyst.
Investors should not buy the shares purely on the assumption that an IPO is imminent.
Investment View
Business Quality: ★★★★☆
The underlying business is interesting because it combines:
- Precision engineering
- Automotive exposure
- Renewable-energy opportunity
- Customised manufacturing
- Quality certifications
- Export potential
Growth: ★★★★★
The historical revenue growth is exceptionally strong, with revenue increasing from ₹18.56 Cr in FY23 to ₹78.57 Cr in FY25.
However, sustaining this growth rate will become increasingly difficult as the base expands.
Balance Sheet: ★★☆☆☆
This is the weakest area.
Debt/equity of around 2.25x and substantial working-capital requirements need close monitoring.
Cash Flow: ★★☆☆☆
FY25 operating cash flow was negative despite positive PAT.
Cash conversion needs to improve.
Valuation: ★★☆☆☆
At approximately ₹381–₹400, the valuation already assumes substantial future growth.
The stock does not look cheap on FY25 earnings.
Overall Assessment
Bolzen & Mutter is an interesting high-growth precision-fastener business, but it should not be evaluated solely on its impressive revenue CAGR.
The investment story has two sides.
The Positive Side
The company has demonstrated:
- Very strong revenue growth
- Growing profitability
- Automotive customer relationships
- Solar/renewable-energy opportunity
- Customised manufacturing capabilities
- Quality certifications
- High promoter ownership
- Expansion of manufacturing assets
The Concern
At the same time:
- Debt is high
- Working capital is substantial
- FY25 operating cash flow was negative
- EBITDA margins declined materially
- The company is still relatively small
- Unlisted liquidity is limited
- Current valuation is already around 25–26x FY25 earnings
Our View
At ₹381–₹400, Bolzen & Mutter should be treated as a growth-at-a-reasonable-price only if the investor has high conviction that earnings will continue to compound rapidly.
The most important things to monitor over the next 2–3 years are:
Revenue growth + EBITDA margin + operating cash flow + debt reduction + solar contribution.
If revenue continues growing strongly while EBITDA margins recover and debt falls, the current valuation could become reasonable.
If revenue growth slows while margins remain around 8% and leverage stays high, the current valuation provides a much smaller margin of safety.
Therefore, this is more of a high-growth/special-situation unlisted opportunity than a conventional deep-value stock.
Key Numbers at a Glance
| Metric | Latest Available |
|---|---|
| FY25 Revenue | ₹78.57 Cr |
| FY25 EBITDA | ₹6.15 Cr |
| FY25 PAT | ₹3.65 Cr |
| FY25 EPS | ₹14.93 |
| Net Worth | ~₹84.84 Cr |
| Borrowings | ~₹191 Cr |
| Debt/Equity | ~2.25x |
| Book Value | ~₹35/share |
| Current Indicative Price | ~₹381–₹400 |
| Market Cap | ~₹93–98 Cr |
| FY25 P/E | ~25–27x |
| Promoter Holding | ~95.25% |
| IPO/DRHP | Not filed |
| Listing Status | Unlisted |
Important: FY25 remains the latest fully verifiable financial dataset used for the core valuation analysis above. Although references to FY26 audited statements exist online, a complete FY26 financial statement set was not reliably available through the company’s public website/searchable investor materials, so FY26 numbers have not been invented or substituted into the analysis.
Disclaimer
This report is prepared for research and informational purposes only and should not be considered investment advice, a recommendation to buy or sell securities, or a guarantee of future returns.
Unlisted securities involve significantly higher liquidity, valuation, disclosure and exit risks compared with listed securities. Indicative unlisted prices can vary substantially between intermediaries and are not equivalent to exchange-traded market prices.
Investors should independently verify the latest audited financial statements, shareholding, debt, valuation, tax implications, transaction terms and availability of shares before investing.
For more such unlisted stocks visit https://unlistedcart.com/unlisted-shares/