CIN: L74899HR1962PLC002618
ISIN: INE499C01012
Face Value: ₹10 per share
Incorporated: 1962
Registered Office & Factory: Faridabad, Haryana
Exchange Status: Listed on MSEI, but extremely illiquid
Shares Outstanding: 59,99,750
Promoter Holding: 62.45%
FY26 Revenue from Operations: ₹476.52 Cr
FY26 PAT: ₹19.23 Cr
FY26 EPS: ₹32.05
FY26 Net Worth: ₹327.17 Cr
Q1 FY27 Revenue: ₹120.8 Cr
Q1 FY27 PAT: ₹7.6 Cr
Current Indicative Price: ~₹2,020–₹2,075/share
Indicative Market Capitalisation: ~₹1,212–₹1,245 Cr
Executive Summary
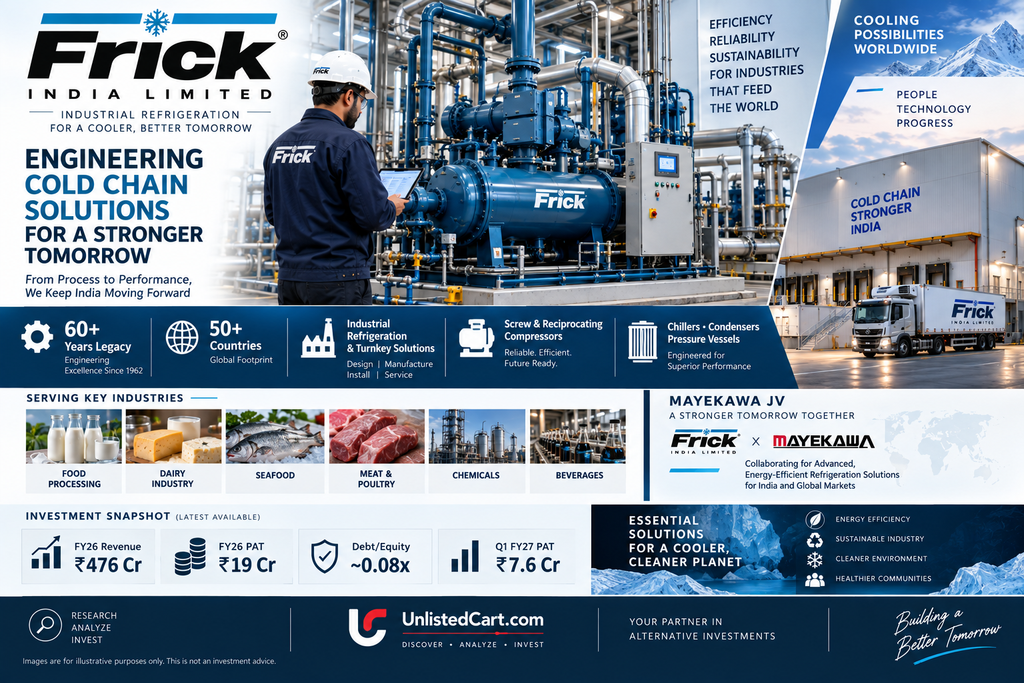
Frick India Limited is a specialised industrial refrigeration and air-conditioning engineering company with a history dating back to 1962. The company designs, manufactures, installs and services industrial refrigeration systems for industries such as food processing, dairy, cold chain, beverages, breweries, seafood, meat and poultry, chemicals and other process industries.
Its product portfolio includes:
- Screw compressors
- Reciprocating compressors
- Air-cooling units
- Evaporative condensers
- Pressure vessels
- Refrigerant pumps
- MCC & PLC panels
- Pillow plates
- Chillers
- Ice-making systems
- Blast freezers
- PUF panels
- Turnkey refrigeration systems
The company provides a single-source solution covering design, manufacturing, installation, commissioning and service, which gives it an important position in complex industrial refrigeration projects.
The investment story has two very different sides.
Positives
Strong legacy + specialised technology + established customer relationships + low leverage + industrial refrigeration opportunity + new Mayekawa JV + strong Q1 FY27 recovery.
Concerns
FY26 margin compression + weak cash-flow conversion + high valuation on FY26 earnings + working-capital requirements + extremely low trading liquidity.
The most important development is the company’s Mayekawa joint venture, which is expected to manufacture energy-efficient screw-compressor packages for India and international markets. The JV combines Frick India’s industrial-refrigeration expertise with Mayekawa’s compressor technology.
At around ₹2,050–₹2,075, however, the company is not cheap on FY26 earnings. The stock is trading at roughly 64× FY26 EPS at ₹2,070.
The investment case therefore depends heavily on whether FY27 becomes a meaningful earnings-recovery year.
Company Overview
Frick India was incorporated in 1962 in collaboration with Frick Company USA. Over the decades, it developed into an independent Indian industrial-refrigeration company.
The company currently operates from a large manufacturing complex at Faridabad, Haryana, and maintains branches across several Indian industrial centres. The company describes itself as a manufacturer and turnkey solution provider for industrial refrigeration and air-conditioning systems.
The business is managed by Jasmohan Singh, who has served as Managing Director since 1999. The company says he has been associated with Frick India since 1986.
Frick India – Official Website
Important Listing Status Clarification
Frick India should not technically be described as an unlisted company.
It has an MSEI symbol FRICKINDIA and is listed on the Metropolitan Stock Exchange of India. However, the exchange data shows essentially no regular trading activity, while unlisted-market platforms also describe the shares as privately/illiquid traded.
This distinction matters because investors face many of the same practical issues as an unlisted investment:
- Very limited liquidity
- Large bid-ask spreads
- Limited price discovery
- Difficulty exiting quickly
- OTC/intermediary price differences
Therefore, this report evaluates Frick India from an illiquid-share investment perspective.
Business Model
Frick India’s primary business is the manufacture, supply and execution of industrial refrigeration and air-conditioning systems.
The company operates as a single reportable business segment.
Its business model covers the complete project lifecycle:
Design → Engineering → Manufacturing → Installation → Commissioning → Service
This integrated model is particularly relevant for industrial customers because refrigeration systems can be highly customised depending on:
- Temperature requirements
- Production process
- Refrigerant
- Plant size
- Energy efficiency
- Storage requirements
- Environmental regulations
Key Industries Served
Frick India provides refrigeration solutions to a wide range of industries.
Dairy & Ice Cream
Large dairy plants require continuous refrigeration for:
- Milk processing
- Chilling
- Ice cream
- Cold storage
- Frozen products
Food & Agriculture
Cold-chain infrastructure is becoming increasingly important as India’s food-processing and organised distribution ecosystem expands.
Beverages & Brewery
Industrial refrigeration is required for breweries, beverage plants and related processing applications.
Meat, Poultry & Seafood
Temperature-controlled processing and storage create significant demand for industrial refrigeration.
Chemical Industry
Industrial cooling is also required in chemical and process industries.
The company’s official website lists these industries among its installation and commissioning capabilities.
Product Portfolio
Frick India’s product portfolio is relatively diversified within industrial refrigeration.
Compressors
- Screw compressors
- Reciprocating compressors
Cooling Equipment
- Air-cooling units
- Condensers
- Chillers
Process Equipment
- Pressure vessels
- Refrigerant pumps
- Pillow plates
Automation
- MCC panels
- PLC panels
- Energy-management systems
Specialised Refrigeration
- Ice-making equipment
- Blast freezers
- Plate freezers
- PUF panels
The company also provides complete turnkey systems rather than merely selling individual components.
Technology Partnerships
Technology partnerships have historically been an important part of Frick India’s development.
The company has worked with international technology partners and currently has a particularly important relationship with Mayekawa Mfg. Co. Ltd., Japan.
The Mayekawa relationship dates back to the company’s use of Mycom compressor technology, and in January 2025 Frick India and Mayekawa formally entered into a joint venture arrangement.
Mayekawa Joint Venture – Major Growth Catalyst
This is arguably the most important strategic development for Frick India.
In January 2025, Frick India and Mayekawa agreed to establish a joint venture to manufacture screw-compressor packages.
The original agreement contemplated:
- Frick India: 49%
- Mayekawa: 51%
The JV is intended to address both domestic and international markets.
The technology is expected to target:
- Food & cold chain
- Process gas
- Biogas
- Heat pumps
- Energy-efficient refrigeration
The companies have also established the JV’s manufacturing initiative at Neemrana, Rajasthan.
Why This Matters
The JV can potentially provide Frick India with:
Better technology + higher-efficiency compressors + new product capability + access to Mayekawa technology + export opportunity.
This could improve the company’s competitive positioning if commercial production scales successfully.
Industry Opportunity
The long-term opportunity for industrial refrigeration in India is supported by several structural trends.
Cold Chain
India’s expanding food-processing industry requires greater cold storage and temperature-controlled transportation.
Food Processing
Growth in:
- Dairy
- Frozen food
- Meat
- Seafood
- Beverages
- Ready-to-eat food
creates additional demand for industrial cooling.
Energy Efficiency
Industrial refrigeration can consume substantial amounts of electricity.
Customers therefore increasingly seek systems that deliver:
Lower energy consumption + better reliability + lower lifecycle cost.
This aligns with Frick India’s focus on high-efficiency refrigeration systems and the Mayekawa partnership.
Environmental Regulations
Refrigerant efficiency and environmental considerations are becoming increasingly important.
Frick India states that it manufactures high-efficiency compression systems using sustainable refrigerants.
FY2025–26 Financial Performance
FY26 was a mixed year.
Revenue increased, but profitability declined sharply.
| Particulars | FY24 | FY25 | FY26 |
|---|---|---|---|
| Revenue from Operations | ₹481.28 Cr | ₹436.94 Cr | ₹476.52 Cr |
| Total Revenue | ₹493.67 Cr | ₹447.63 Cr | ₹486.19 Cr |
| EBITDA | ₹58.55 Cr | ₹51.97 Cr | ₹34.28 Cr |
| EBITDA Margin | 11.86% | 11.61% | 7.05% |
| PBT | ₹52.92 Cr | ₹46.00 Cr | ₹26.26 Cr |
| PAT | ₹42.31 Cr | ₹34.64 Cr | ₹19.23 Cr |
| EPS | ₹705.20* | ₹57.74 | ₹32.05 |
*FY24 EPS is distorted by the subsequent 9:1 bonus issue and therefore should not be compared directly with post-bonus EPS without adjustment.
FY26 revenue from operations increased approximately 9.1%, but PAT declined approximately 44.5%. EBITDA margin dropped from 11.61% to 7.05%.
Why Did Profitability Fall?
The primary issue was cost inflation and margin compression.
Material consumption increased from approximately ₹287.66 Cr in FY25 to ₹355.77 Cr in FY26, substantially faster than revenue growth. Employee expenses also increased from ₹63.27 Cr to ₹68.52 Cr.
This created a classic operating-margin problem:
Revenue ↑ 9%
but material costs ↑ much faster
→ EBITDA ↓
→ PAT ↓
The company also recognised an exceptional charge of approximately ₹3.22 Cr relating to past-service costs for gratuity and compensated absences associated with the newly notified labour-code framework.
However, this exceptional item alone does not explain the full profit decline. The bigger issue was operating-cost pressure.
Five-Year Financial Trend
| FY | Revenue from Operations | PAT |
|---|---|---|
| FY22 | ₹280.47 Cr | ₹16.36 Cr |
| FY23 | ₹362.82 Cr | ₹28.51 Cr |
| FY24 | ₹481.28 Cr | ₹42.31 Cr |
| FY25 | ₹436.94 Cr | ₹34.64 Cr |
| FY26 | ₹476.52 Cr | ₹19.23 Cr |
The longer-term picture shows substantial revenue expansion since FY22, but earnings have been much more volatile.
Revenue CAGR over the FY22–FY26 period is approximately 14%, while the latest FY26 year shows clear margin deterioration.
This tells us that Frick India is a growth-plus-cyclicality story rather than a predictable compounder at present.
Balance Sheet
FY26 balance-sheet data shows:
- Total Assets: ₹465.85 Cr
- Net Worth: ₹327.17 Cr
- Total Liabilities: ₹138.69 Cr
- Non-current liabilities: ₹10.63 Cr
- Current liabilities: ₹128.06 Cr
- Current assets: ₹330.30 Cr
- Non-current assets: ₹135.55 Cr
The balance sheet remains reasonably comfortable relative to the company’s size.
Debt-to-equity is low, around 0.08× according to current market data.
This means the FY26 earnings decline was not primarily caused by excessive financial leverage.
Cash Flow – Important Concern
This is one of the weaker areas of the FY26 financial profile.
Operating cash flow:
- FY24: ₹1.41 Cr
- FY25: ₹61.95 Cr
- FY26: –₹9.99 Cr
So despite reporting ₹19.23 Cr PAT in FY26, the company generated negative operating cash flow of nearly ₹10 Cr.
Investing cash flow was also negative at ₹24.97 Cr.
Consequently, cash and cash equivalents declined from approximately ₹22.37 Cr to ₹1.37 Cr by the end of FY26.
This is a key monitorable.
For an engineering/project-oriented business, profits can fluctuate because of:
- Project billing
- Receivables
- Inventory
- Customer advances
- Retention money
- Working-capital cycles
Therefore, investors should not evaluate Frick India only on PAT.
Cash conversion needs to improve.
FY26 Profitability Ratios
| Ratio | FY25 | FY26 |
|---|---|---|
| EBITDA Margin | 11.61% | 7.05% |
| EBIT Margin | 10.87% | 6.17% |
| PAT Margin | 7.74% | 3.96% |
| ROE | 11.25% | 5.88% |
| ROCE | 15.38% | 8.88% |
| Interest Coverage | 18.41× | 8.02× |
The deterioration across nearly every profitability metric confirms that FY26 was a challenging earnings year.
Q1 FY2027 – Strong Recovery Signal
This is where the story becomes considerably more interesting.
Frick India reported approximately:
- Revenue from operations: ₹120.8 Cr
- YoY growth: ~60%
- PBT: ₹9.8 Cr
- PAT: ₹7.6 Cr
- PAT growth: ~191%
- EBITDA: ~₹11.8 Cr
- EBITDA margin: ~9.8%
- EPS: ₹12.65
compared with PAT of ₹2.6 Cr in Q1 FY26.
This is a meaningful improvement.
Q1 FY27 vs Q1 FY26
| Metric | Q1 FY26 | Q1 FY27 | Change |
|---|---|---|---|
| Revenue | ~₹75 Cr | ₹120.8 Cr | ~60% |
| PAT | ₹2.6 Cr | ₹7.6 Cr | ~191% |
| PBT | ₹3.3 Cr | ₹9.8 Cr | ~199% |
| EBITDA | ~₹5 Cr | ₹11.8 Cr | ~136% |
| EBITDA Margin | ~7% | ~9.8% | Improved |
One quarter does not establish a trend, but it provides evidence that the FY26 margin pressure may be reversible.
FY27 Earnings Scenario
If Q1 FY27 PAT of ₹7.6 Cr were simply annualised:
₹7.6 Cr × 4 = ~₹30.4 Cr FY27 PAT
This is not a forecast; it is only a mathematical annualisation.
If the company achieves ₹30–35 Cr PAT in FY27, the valuation becomes more reasonable than it appears on FY26 earnings.
For example, at approximately ₹2,070/share and 59.9975 lakh shares, market capitalisation is approximately ₹1,242 Cr.
| FY27 PAT | Market Cap / PAT |
|---|---|
| ₹20 Cr | 62.1× |
| ₹25 Cr | 49.7× |
| ₹30 Cr | 41.4× |
| ₹35 Cr | 35.5× |
| ₹40 Cr | 31.0× |
| ₹45 Cr | 27.6× |
| ₹50 Cr | 24.8× |
Therefore, the current price requires a substantial earnings recovery to become comfortably valued.
Bonus Issue & EPS Interpretation
A very important point for historical analysis is the company’s 9:1 bonus issue.
In October 2024, the company issued 9 bonus shares for every 1 existing share.
The number of shares increased from approximately 5.99975 lakh to 59.9975 lakh shares.
This means historical EPS figures such as ₹705 in FY24 are not directly comparable with the current ₹32 FY26 EPS without adjusting for the bonus.
After normalising for the 10× increase in share count, the FY24 EPS would be roughly ₹70.52.
Therefore:
FY24 normalised EPS ~₹70.5
FY25 EPS ₹57.7
FY26 EPS ₹32.1
This makes the FY26 earnings decline more understandable and avoids a misleading interpretation of the historical EPS series.
Shareholding
As of March 31, 2026:
- Promoters: 62.45%
- Public/Others: 37.55%
Total shares: 59,99,750.
Promoter ownership remains substantial, providing meaningful alignment with shareholders.
The historical promoter group includes Jasmohan Singh and members of the Singh/Kaur family. FY25 annual-report disclosures show Jasmohan Singh’s joint holding as the largest promoter position.
Competitive Advantages
1. Long Operating History
Frick India has operated in industrial refrigeration since 1962.
2. Specialised Engineering Capability
Industrial refrigeration requires engineering expertise, plant design, safety systems, process understanding and installation capabilities.
3. Turnkey Capability
The ability to provide:
Design + Manufacturing + Installation + Commissioning + Service
creates a stronger customer relationship than selling individual components.
4. Technology Partnerships
Long-standing relationships with international technology companies have helped Frick India develop advanced compressor and refrigeration solutions.
5. Mayekawa JV
The Mayekawa partnership provides an important potential technology and product catalyst.
6. Diversified End Markets
Exposure across food, dairy, beverages, seafood, meat, chemicals and other industrial applications reduces dependence on a single end market.
Growth Drivers
Cold-Chain Infrastructure
India’s cold-storage and food-processing infrastructure continues to develop, creating demand for industrial refrigeration.
Food Processing
Growth in dairy, frozen food, seafood and processed food can increase demand for temperature-controlled infrastructure.
Energy Efficiency
Customers increasingly focus on lowering electricity consumption, supporting demand for high-efficiency refrigeration.
Mayekawa Technology
The JV can potentially create a new growth platform in screw-compressor packages.
Heat Pumps & Sustainable Refrigeration
The Mayekawa partnership specifically identifies opportunities in process gas, biogas and heat-pump applications.
Export Potential
Frick India has historically exported its products and technology to developed markets, according to the company’s own disclosures.
Key Risks
1. Valuation Risk
This is currently the biggest investment concern.
At ₹2,070 and FY26 EPS of ₹32.05:
P/E ≈ 64.6×
Planify similarly reports a P/E around 64.5× at ₹2,070.
This is a high multiple for a company that delivered only 5.9% ROE in FY26.
2. Margin Volatility
EBITDA margin declined from 11.61% to 7.05% in FY26.
The business needs to demonstrate sustained margin recovery.
3. Negative Operating Cash Flow
FY26 operating cash flow was negative ₹9.99 Cr despite positive PAT.
4. Working Capital
Engineering and turnkey projects can require significant working capital.
5. Project Execution
Delays in large projects can affect revenue recognition and profitability.
6. JV Execution Risk
The Mayekawa JV is strategically promising, but investors need to monitor:
- Commercial production
- Capacity utilisation
- Capex
- Customer wins
- Profitability
- Return on invested capital
7. Extremely Low Liquidity
The company is listed on MSEI, but the security has essentially no regular trading activity.
This makes exit risk significant.
8. Price Dispersion
Current unlisted/OTC references differ:
- Planify: ~₹2,070
- UnlistedZone: ~₹2,075
- Chryseum: ~₹2,020
- Neoma: ~₹2,054
These are indicative references rather than a continuously discoverable exchange price.
Current Indicative Price
As of September 2026, Frick India is broadly referenced around:
₹2,020–₹2,075/share
Planify reported ₹2,070 on September 14, while UnlistedZone reported ₹2,075 on September 14 and Chryseum reported ₹2,020 on September 11.
At ₹2,070:
59,99,750 shares × ₹2,070 ≈ ₹1,242 Cr market capitalisation.
This is broadly consistent with Planify’s reported market cap of ₹1,241.95 Cr.
Valuation
FY26 Valuation at ₹2,070
- Market Cap: ~₹1,242 Cr
- FY26 EPS: ₹32.05
- P/E: ~64.6×
- Book Value: ~₹545/share
- P/B: ~3.8×
- Debt/Equity: ~0.08×
- ROE: ~5.9%
- ROCE: ~8.9%
This tells us something very important:
Frick India is financially sound, but it is not cheap on current earnings.
Earnings-Based Valuation
Using FY26 EPS of ₹32.05:
| P/E | Indicative Value |
|---|---|
| 20× | ₹641 |
| 25× | ₹801 |
| 30× | ₹962 |
| 35× | ₹1,122 |
| 40× | ₹1,282 |
| 45× | ₹1,442 |
| 50× | ₹1,603 |
| 60× | ₹1,923 |
| 65× | ₹2,083 |
At approximately ₹2,070, the market is effectively valuing Frick India at around 65× FY26 earnings.
That is a demanding valuation.
What Earnings Would Justify ₹2,070?
This is a more useful way of looking at the opportunity.
At ₹2,070:
25× P/E
Required EPS = ₹82.8
Required PAT ≈ ₹49.7 Cr
30× P/E
Required EPS = ₹69.0
Required PAT ≈ ₹41.4 Cr
35× P/E
Required EPS = ₹59.1
Required PAT ≈ ₹35.5 Cr
40× P/E
Required EPS = ₹51.75
Required PAT ≈ ₹31.0 Cr
Therefore, at the current price, investors are effectively betting on a substantial recovery in earnings.
Q1 FY27 Changes the Valuation Picture
Q1 FY27 PAT was ₹7.6 Cr.
If Frick India can sustainably generate:
₹30 Cr PAT → ~41× P/E
₹35 Cr PAT → ~35× P/E
₹40 Cr PAT → ~31× P/E
₹45 Cr PAT → ~28× P/E
The valuation therefore becomes progressively more reasonable as earnings recover.
But a 3–4 quarter recovery needs to be demonstrated before assigning a high-growth multiple.
Dividend
Frick India declared a ₹0.40/share dividend for FY25 following the 9:1 bonus issue.
MSEI has also recorded the company’s final-dividend corporate-action process in September 2026.
At approximately ₹2,070, a ₹0.40 dividend represents only around 0.02% yield.
Therefore, this is clearly not a dividend-yield investment.
The investment thesis has to be based on:
earnings recovery + business growth + Mayekawa JV + potential future re-rating/liquidity.
IPO / Public-Market Liquidity
Frick India is already technically listed on MSEI, but the shares have extremely limited trading activity.
There is therefore no need to build the investment case around an IPO.
The potential catalysts are instead:
- Earnings recovery
- Mayekawa JV commercialisation
- Margin improvement
- Improved cash conversion
- Increased institutional/public participation
- Potential migration/listing on a more liquid exchange, if ever pursued
None of these should be treated as guaranteed.
Investment Scorecard
| Parameter | Assessment |
|---|---|
| Business Quality | 8/10 |
| Industry Opportunity | 8.5/10 |
| Technology | 8.5/10 |
| Mayekawa JV Potential | 9/10 |
| Balance Sheet | 8/10 |
| FY26 Profitability | 5.5/10 |
| Cash Flow | 5/10 |
| FY27 Recovery Potential | 8/10 |
| Current Valuation | 4.5/10 |
| Liquidity | 2/10 |
| Overall | 6.8/10 |
Overall Assessment
Frick India is a fundamentally interesting industrial-refrigeration company, but the current valuation leaves little room for disappointment based on FY26 earnings.
The business itself has several attractive characteristics:
**60+ years of experience
- specialised industrial refrigeration expertise
- turnkey capabilities
- established customer base
- low financial leverage
- energy-efficiency opportunity
- Mayekawa technology partnership
- exposure to India’s cold-chain and food-processing growth.**
The problem is that FY26 earnings did not keep pace with revenue.
Revenue grew from ₹436.94 Cr to ₹476.52 Cr, but PAT declined from ₹34.64 Cr to ₹19.23 Cr, while EBITDA margin fell from 11.61% to 7.05%.
However, Q1 FY27 provides an encouraging early signal.
Revenue grew approximately 60% and PAT nearly tripled to ₹7.6 Cr.
Therefore, the investment question is no longer simply:
“Is Frick India a good company?”
The more important question is:
“Can Frick India recover FY26’s lost margins and sustainably reach ₹35–₹45 Cr+ PAT?”
If the answer is yes, the current valuation can become more defensible.
If FY27 earnings remain around ₹20–₹25 Cr, the current ₹2,000+ price looks difficult to justify.
Investment View
BUSINESS: Strong niche industrial franchise
TECHNOLOGY: Strong
JV: Potentially transformational
BALANCE SHEET: Healthy
FY26 EARNINGS: Weak
Q1 FY27: Very encouraging
CASH FLOW: Needs improvement
VALUATION: Expensive on FY26 earnings
LIQUIDITY: Very poor
Final Verdict
Frick India is a QUALITY INDUSTRIAL BUSINESS with a potentially important Mayekawa-led growth catalyst, but at ~₹2,000–₹2,075 the stock is priced for a significant earnings recovery.
For a new investor, I would focus heavily on the next 2–3 quarters.
The key checklist should be:
- Revenue growth >10–15%
- EBITDA margin moving back toward 10–12%
- PAT moving toward ₹30–40 Cr+ annually
- Operating cash flow turning positive
- Mayekawa JV commercial production
- Improving ROCE
- Receivables/working capital under control
If these indicators improve together, the current valuation could become more reasonable.
Our view: STRONG INDUSTRIAL FRANCHISE — PROMISING MAYEKAWA JV — FY27 RECOVERY STORY — BUT CURRENT PRICE REQUIRES EARNINGS IMPROVEMENT AND OFFERS LIMITED MARGIN OF SAFETY ON FY26 NUMBERS.
Important Disclaimer
This report is prepared for research and educational purposes using Frick India’s official disclosures, MSEI filings, company information, audited FY2025–26 financial data and publicly available market references.
Frick India is technically listed on MSEI, but the shares are extremely illiquid and may not have a continuously discoverable market price. Prices quoted by private-market intermediaries are indicative and can differ materially from actual negotiated transaction prices.
Q1 FY27 figures are unaudited quarterly figures. Any annualisation of Q1 FY27 earnings is a mathematical scenario and not a management forecast or audited full-year result.
Investments in illiquid/privately traded securities carry substantial risks including limited liquidity, wide bid-ask spreads, price uncertainty, difficulty in exiting, valuation risk and possible loss of capital.
This report does not constitute investment advice, an offer, solicitation or recommendation to buy or sell securities.
For more such unlisted stocks visit https://unlistedcart.com/unlisted-shares/