CIN: U00000CH2004PLC027625
ISIN: INE528I01015
Face Value: ₹10 per share
Incorporated: 8 November 2004*
Registered Office: Chandigarh
Corporate Office: Mohali, Punjab
Listing Status: Unlisted Public Company
Paid-up Capital: ~₹25.10 Cr
Shares Outstanding: ~2.51 Cr
FY25 Revenue: ₹460.97 Cr
FY25 PAT: ₹15.02 Cr
H1 FY26 Revenue: ₹345.8 Cr
H1 FY26 PAT: ₹32.1 Cr
Current Indicative Price: ~₹85–₹102/share
Indicative Market Capitalisation: ~₹213–₹257 Cr
*The operating business traces its origins to 1992, while the present limited-company entity was incorporated in 2004.
Executive Summary
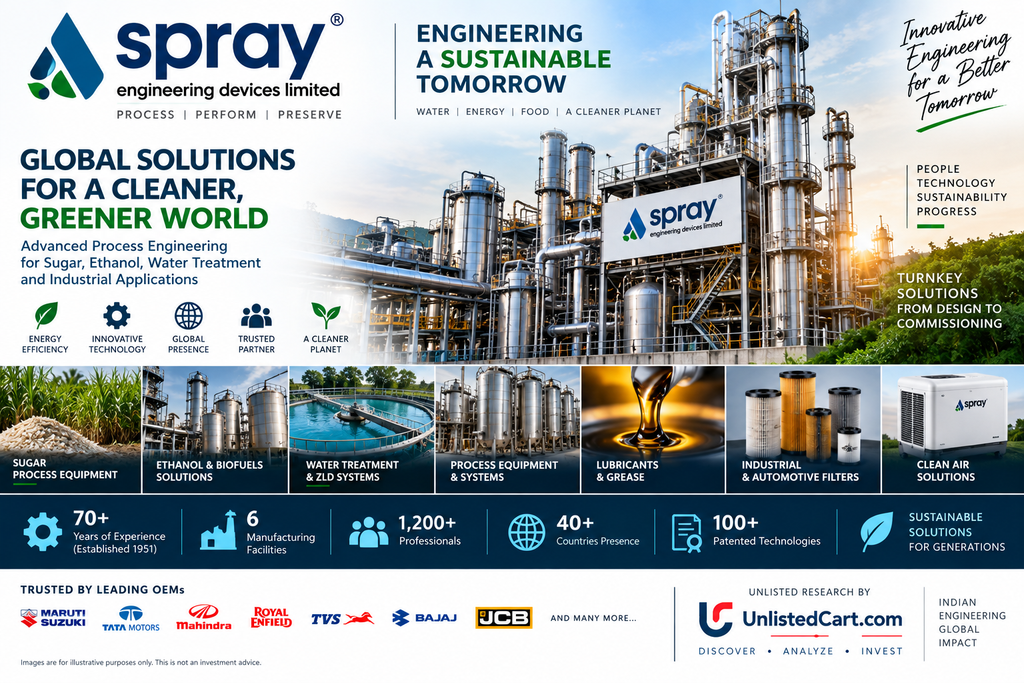
Spray Engineering Devices Limited is a technology-led process engineering and equipment manufacturing company serving the sugar, ethanol/biofuels, jaggery, water-treatment and process industries.
The company began with energy-efficient spray nozzles and has evolved into an engineering solutions provider covering equipment design, manufacturing, automation, EPC solutions, process engineering and after-sales support. Its technologies include evaporation, condensation, crystallisation, vaporisation and heat-exchange systems.
One of the company’s biggest competitive advantages is its intellectual-property portfolio. SED states that it has 100+ patented technologies, while its flagship innovations include the Low Temperature Evaporation (LTE®) system based on MVR technology, designed for energy-efficient water recovery and zero-liquid-discharge applications.
The FY25 financial year was weak:
- Revenue fell approximately 16%
- PAT fell approximately 72%
- EBITDA margin declined sharply
- Operating cash flow turned negative
- Working capital expanded substantially
However, H1 FY26 indicates a significant recovery. H1 FY26 operating income reached approximately ₹345.8 Cr and PAT ₹32.1 Cr, already more than double FY25’s full-year PAT. H1 FY26 operating margin recovered to approximately 15.2%.
The company also had an order book of approximately ₹800 Cr as of November 2025, equivalent to roughly 1.7× FY25 revenue, providing meaningful medium-term revenue visibility.
At current indicative prices around ₹85–₹100, the valuation looks considerably more attractive than it did when FY25 earnings were depressed.
However, this is not a simple low-risk value stock.
The biggest concerns are:
working-capital intensity + long receivable cycles + fixed-price contracts + steel-price volatility + project execution risk.
Company Overview
Spray Engineering Devices was founded in 1992 by Vivek Verma and N.K. Verma, initially focusing on energy-efficient spray nozzles.
The company subsequently expanded into:
- Condensers
- Cooling systems
- Sugar-process equipment
- Automation
- Evaporation systems
- Distillation systems
- Water-treatment solutions
- Jaggery plants
- Biofuel solutions
- Turnkey EPC projects
SED became a limited company in 2004.
The company’s present registered office is in Chandigarh, with its corporate office in Mohali and manufacturing facilities primarily in Baddi, Himachal Pradesh. The company also has offices/operations in Pune, Dubai and the United States.
Spray Engineering Devices – Official Website
Business Model
SED operates a specialised engineering model rather than a conventional commodity manufacturing business.
The company designs and manufactures equipment and provides complete engineering solutions to process industries.
Its business can broadly be divided into five verticals:
1. Sugar
This remains one of SED’s core markets.
Products and solutions include:
- Evaporators
- Condensers
- Cooling systems
- Sugar-process equipment
- Automation
- Energy-efficient systems
- Complete sugar plants/refineries
The company has executed projects in sugar mills and refineries across India and overseas.
2. Water Treatment
SED’s LTE/MVR technology is particularly relevant to industrial wastewater treatment.
The system aims to reduce energy consumption while enabling water recovery and zero-liquid-discharge applications.
This creates potential demand from industries such as:
- Textiles
- Pharmaceuticals
- Chemicals
- Sugar
- Distilleries
- Other water-intensive industries
SED itself identifies water treatment as one of its major business verticals.
3. Biofuels / Ethanol
India’s ethanol-blending programme creates a structural opportunity for process-engineering companies supplying distillery and biofuel infrastructure.
SED provides:
- MVR-based distillation
- Energy-efficient distillery systems
- Process optimisation
- Turnkey solutions
- Automation
The company’s order book was approximately 75% exposed to sugar/ethanol and 25% to water treatment in the November 2025 assessment.
4. Jaggery
SED has developed technology for boiler-free jaggery production.
The objective is to improve energy efficiency and reduce the environmental footprint of jaggery production.
This is an interesting niche because it combines:
traditional Indian agriculture + process engineering + energy efficiency.
5. Product Concentration
The company also provides solutions for concentration and recovery of products in industrial processes.
This allows SED to address applications beyond the traditional sugar industry.
Technology & Intellectual Property
Technology is arguably the most important part of the investment thesis.
SED states that it has 100+ patented technologies and an R&D-driven business model.
Its flagship innovation is the:
Low Temperature Evaporator – LTE®
LTE uses MVR-based technology to achieve energy-efficient evaporation.
The system can be used for:
- Wastewater concentration
- Water recovery
- Zero-liquid discharge
- Industrial effluent treatment
- Process concentration
The company reports that its technology has been deployed internationally, including a major installation at Al Khaleej Sugar in Dubai, described by SED as the world’s largest standalone sugar refinery at the time of installation.
This technology-led positioning is important because it potentially allows SED to compete on energy savings and process economics, rather than merely equipment price.
Global Presence
SED states that its solutions have been deployed across 40+ countries.
The company has executed more than 80 projects internationally according to unlisted-market research.
Its international presence includes:
- Middle East
- Africa
- Asia
- Latin America
- Other emerging markets
The company also maintains an international channel partner in Dubai and an affiliate office in the United States.
Manufacturing Infrastructure
SED’s manufacturing operations are centred around Baddi, Himachal Pradesh.
The company’s official contact information identifies:
- Baddi rotating machinery unit
- Baddi automation unit
- Baddi heat-exchange equipment unit
The company also has its corporate base in Mohali and registered office in Chandigarh.
Its integrated manufacturing capability allows the company to control:
design → engineering → manufacturing → automation → installation → commissioning → after-sales service.
This integrated model can create stronger customer relationships and higher switching costs.
FY2024–25 Financial Performance
FY25 was a difficult year.
Consolidated Financials
| Particulars | FY24 | FY25 | Change |
|---|---|---|---|
| Revenue from Operations | ₹547.35 Cr | ₹460.97 Cr | -15.8% |
| Total Income | ₹548.28 Cr | ₹461.83 Cr | -15.8% |
| PBT | ₹74.34 Cr | ₹20.56 Cr | -72.3% |
| PAT | ₹53.16 Cr | ₹15.02 Cr | -71.7% |
| EPS | ₹23.19 | ₹5.95 | -74.3% |
The audited FY25 annual report confirms consolidated revenue of ₹460.97 Cr and PAT of ₹15.02 Cr.
The decline was substantial and should not be ignored.
Why Did FY25 Earnings Collapse?
The FY25 decline appears to have been driven more by project execution and cost pressures than by the disappearance of the company’s underlying opportunity.
Unlisted-market/credit research attributes the revenue decline substantially to delays in certain export orders.
At the same time, SED operates under contracts where:
- Steel is a major raw material
- Many contracts are fixed-price
- Price escalation clauses may be limited
- Project execution can take time
- Customers can retain payments until performance/defect-liability periods expire
Steel accounts for approximately 70–75% of raw-material procurement, according to recent research.
Therefore, a combination of:
delayed execution + higher steel prices + working-capital requirements
can sharply compress profitability in a particular year.
H1 FY2026 – Major Recovery
This is where the investment story becomes significantly more interesting.
According to the latest available H1 FY26 data:
| Particular | H1 FY26 |
|---|---|
| Operating Income | ₹345.8 Cr |
| PAT | ₹32.1 Cr |
| OPBDIT Margin | 15.2% |
| Interest Coverage | 9.9x |
| Total Debt / OPBDIT | ~0.9x |
H1 FY26 PAT of ₹32.1 Cr is already more than 2× FY25’s full-year PAT of ₹15.0 Cr.
The operating margin also recovered from approximately 8.4% in FY25 to 15.2% in H1 FY26.
This suggests that FY25 may have represented an earnings trough rather than a permanent deterioration in the business.
Order Book
One of the most important numbers for SED is its order book.
As of approximately November 2025, the order book was estimated at:
~₹800 Cr
This was around 1.7× FY25 revenue.
The order mix was approximately:
- 75% Sugar/Ethanol
- 25% Water Treatment
This provides substantial revenue visibility if execution occurs according to schedule.
However, investors should remember an important lesson from FY25:
A large order book does not automatically mean immediate revenue or cash flow.
Execution timing and customer payment cycles are critical.
Working Capital – Biggest Risk
This is probably the most important risk in the entire investment thesis.
SED’s business can generate accounting profits before it receives the corresponding cash.
Customers may retain money against:
- Performance bank guarantees
- Defect-liability periods
- Project completion
- Final acceptance
Recent research indicates that approximately 60% of debtors were more than six months old in FY25, largely because of retention money and project-related payment structures.
The FY25 consolidated balance sheet demonstrates the issue.
FY25
- Inventory: ₹114.25 Cr
- Trade receivables: ₹114.23 Cr
- Other current assets: ₹44.62 Cr
- Cash & equivalents: ₹2.33 Cr
Total assets increased to approximately ₹419.63 Cr from ₹302.18 Cr in FY24.
The company therefore requires meaningful working capital to support growth.
Cash Flow Analysis
FY25 operating cash flow was approximately:
Negative ₹28.78 Cr
This compares with positive operating cash flow of approximately ₹19.12 Cr in FY24.
The negative cash flow was largely associated with the increase in:
- Receivables
- Inventory
- Working-capital requirements
This is a critical point for investors.
PAT recovery without operating cash-flow recovery would not be enough.
For SED, the next major confirmation should be:
PAT ↑ + Receivables controlled + Operating Cash Flow positive
rather than simply PAT growth.
Balance Sheet
FY25 consolidated balance-sheet data shows:
| Particular | FY25 |
|---|---|
| Total Assets | ₹419.63 Cr |
| Equity | ~₹205 Cr* |
| Borrowings – Non-current | ₹17.72 Cr |
| Borrowings – Current | ₹62.11 Cr |
| Lease Liabilities | ~₹13.39 Cr |
| Inventory | ₹114.25 Cr |
| Trade Receivables | ₹114.23 Cr |
| Cash & Equivalents | ₹2.33 Cr |
*Approximate equity based on reported balance-sheet components.
Debt/equity was approximately 0.39×, considerably better than FY24’s 0.61×.
The company therefore does not appear excessively leveraged, but it is not a zero-debt business either.
Credit Profile
ICRA reaffirmed SED’s ratings at approximately:
[ICRA]BBB+ / Stable / [ICRA]A2
in December 2025.
The rating agency expected FY26 performance to improve from the FY25 trough.
H1 FY26 interest coverage of around 9.9× also represents a substantial improvement from FY25’s 3.4×.
This supports the view that the company’s financial profile was recovering alongside earnings.
Competitive Advantages
1. Technology & Patents
100+ patented technologies provide differentiation and potential barriers to entry.
2. Integrated Engineering Capability
SED combines:
engineering + manufacturing + automation + EPC + commissioning + after-sales service.
3. Established Customer Relationships
The company has decades of experience supplying sugar, distillery, water-treatment and process-industry customers.
4. Global Footprint
Technology deployed across 40+ countries gives SED access to international opportunities.
5. Energy-Efficiency Focus
Its solutions can reduce energy consumption for customers, creating a strong economic proposition when energy costs are high.
6. Sustainability Tailwind
Water recycling, zero-liquid discharge, ethanol and biofuels are supported by long-term environmental and regulatory trends.
Growth Drivers
Ethanol & Biofuels
India’s ethanol-blending push supports investment in distillery and biofuel infrastructure.
SED’s MVR-based distillation systems position it to participate in this opportunity.
Water Recycling
Increasing industrial water stress and environmental regulations could accelerate adoption of wastewater-recovery systems.
SED’s LTE technology provides exposure to this structural trend.
International Expansion
The company already operates across 40+ countries and can potentially increase its export contribution.
Sugar Industry Modernisation
Indian sugar mills continue to invest in:
- Energy efficiency
- Capacity upgrades
- Automation
- Ethanol
- Cogeneration
- Process optimisation
This provides a long-term addressable market.
Jaggery Modernisation
Boiler-free jaggery technology represents a niche but potentially scalable opportunity.
Key Risks
1. Working-Capital Intensity
This is the biggest risk.
Revenue growth can consume cash because receivables and retention money remain outstanding for long periods.
2. Steel Price Volatility
Steel represents approximately 70–75% of raw-material procurement.
Fixed-price contracts can therefore create margin pressure when steel prices rise.
3. Project Execution
Large engineering projects can face:
- Delays
- Cost overruns
- Customer delays
- Commissioning issues
- Export logistics problems
FY25 demonstrated the earnings impact that delayed projects can create.
4. Customer Concentration
The company has meaningful exposure to the sugar and ethanol ecosystem.
A slowdown in capital expenditure by sugar/distillery companies could affect new orders.
5. Cyclicality
Engineering orders can fluctuate significantly from year to year.
FY24 → FY25 demonstrates this clearly.
6. Debt
Although gearing is moderate, SED still uses working-capital borrowing.
Growth therefore needs to be accompanied by better cash conversion.
7. Unlisted Liquidity
The stock is not continuously traded on NSE/BSE.
Different intermediaries are currently showing substantially different prices.
Current Unlisted Price
Current September 2026 references show significant price dispersion.
| Source | Indicative Price |
|---|---|
| Planify | ₹84.70 |
| UnlistedZone | ₹88 |
| Moneycontrol | ₹102.33 |
| WWIPL displayed reference | ₹135 |
These are indicative OTC/unlisted references, not exchange-traded prices, and should not be interpreted as firm executable market prices.
The difference between ₹85 and ₹135 is itself a reminder of the liquidity and price-discovery risk in this stock.
Valuation
At ₹84.70/share and approximately 2.51 Cr shares, the implied market capitalisation is approximately:
₹213 Cr
Planify reports FY25 PAT of ₹15.02 Cr and P/E of approximately 14.15× at ₹84.70.
However, FY25 is arguably a poor base year for valuation because earnings were depressed.
The more interesting question is:
What does the stock look like on normalised FY26 earnings?
H1 FY26 PAT was approximately ₹32.1 Cr.
If H2 FY26 merely matches H1 FY26, full-year PAT could be around:
₹64 Cr
This is an annualisation exercise, not reported FY26 audited PAT.
At ₹84.70:
₹213 Cr market cap / ₹64 Cr annualised PAT ≈ 3.3× earnings.
That is extremely inexpensive if the H1 recovery is sustained.
But investors should not automatically capitalise H1 performance for the full year because project businesses can have significant quarterly and half-yearly fluctuations.
Valuation Sensitivity
Using different normalised PAT assumptions:
| Normalised PAT | 8× P/E | 10× P/E | 12× P/E |
|---|---|---|---|
| ₹40 Cr | ₹320 Cr | ₹400 Cr | ₹480 Cr |
| ₹50 Cr | ₹400 Cr | ₹500 Cr | ₹600 Cr |
| ₹60 Cr | ₹480 Cr | ₹600 Cr | ₹720 Cr |
| ₹65 Cr | ₹520 Cr | ₹650 Cr | ₹780 Cr |
| ₹70 Cr | ₹560 Cr | ₹700 Cr | ₹840 Cr |
At approximately ₹213 Cr current market capitalisation, the stock offers significant valuation leverage if FY26 earnings normalisation is genuine and sustainable.
FY25 vs H1 FY26 – The Important Change
| Metric | FY25 | H1 FY26 |
|---|---|---|
| Operating Income | ₹461 Cr | ₹346 Cr |
| PAT | ₹15 Cr | ₹32 Cr |
| OPBDIT Margin | 8.4% | 15.2% |
| Interest Coverage | 3.4× | 9.9× |
| Debt / OPBDIT | 2.4× | ~0.9× |
The direction of change is encouraging.
This is why simply looking at FY25 P/E can give a misleading picture of the current investment opportunity.
IPO / Listing Status
Spray Engineering Devices remains an unlisted public company.
There is no confirmed IPO/listing date in the information reviewed.
Investors should therefore not pay a premium merely on the assumption of an imminent IPO.
Any future IPO would potentially provide liquidity and price discovery, but it should be treated as an optional catalyst rather than the core investment thesis.
Investment Scorecard
| Parameter | Assessment |
|---|---|
| Technology / IP | 9/10 |
| Industry Opportunity | 8.5/10 |
| Order Visibility | 9/10 |
| Business Quality | 8/10 |
| Balance Sheet | 7/10 |
| Cash Flow | 5/10 |
| Growth Potential | 8.5/10 |
| Valuation | 9/10 at ~₹85 |
| Working-Capital Risk | High |
| Unlisted Liquidity | Low |
| Overall | 8/10 |
Overall Assessment
Spray Engineering Devices is a very interesting special situation in the unlisted engineering space.
The FY25 financial numbers look weak at first glance:
Revenue ↓
PAT ↓ sharply
Margins ↓
Operating cash flow negative
But the H1 FY26 numbers materially change the picture.
The company has demonstrated:
**₹800 Cr order book
- 100+ patented technologies
- 40+ country presence
- sugar/ethanol exposure
- water-treatment opportunity
- strong H1 FY26 earnings recovery.**
The most important investment thesis is therefore earnings normalisation.
If FY26 ultimately delivers ₹60–70 Cr of sustainable PAT, the current market capitalisation around ₹210–₹220 Cr could prove inexpensive.
But there is a major caveat:
SED’s biggest weakness is cash conversion.
The company can report strong profits while a substantial amount of money remains locked in:
- Receivables
- Retention money
- Inventory
- Project working capital
Therefore, the next phase of due diligence should focus less on headline PAT and more on:
PAT → CFO conversion
If operating cash flow turns consistently positive while the ₹800 Cr order book is executed, the investment case becomes substantially stronger.
Investment View
Business: Strong niche engineering franchise
Technology: Excellent
Order visibility: Strong
Industry tailwinds: Strong
FY25 financials: Weak
H1 FY26 recovery: Very encouraging
Balance sheet: Moderate/healthy
Cash flow: Key concern
Valuation: Potentially very attractive around ₹85–₹90
Liquidity: High risk
Final Verdict
SED is not simply a sugar-sector equipment company. It is an IP-led process-engineering and sustainability platform with exposure to sugar, ethanol, biofuels and industrial water treatment.
At around ₹85–₹90, the valuation appears particularly interesting provided the H1 FY26 earnings recovery is sustained and working-capital conversion improves.
At ₹120–₹135, the margin of safety becomes meaningfully lower and the investor should demand stronger evidence of FY26/FY27 earnings and cash-flow normalisation.
Our view: HIGH-POTENTIAL SPECIAL SITUATION — STRONG TECHNOLOGY & ORDER BOOK — EARNINGS RECOVERY UNDERWAY — BUT CASH FLOW AND WORKING CAPITAL MUST BE MONITORED CLOSELY.
Important Disclaimer
This report is prepared for research and educational purposes using publicly available company disclosures, the company’s official website, FY2024–25 audited financial statements and current unlisted-market/credit research.
FY2025–26 full-year audited financial results were not independently reproduced from a company annual-report filing in the sources reviewed. H1 FY26 figures and annualised earnings used in the valuation discussion are therefore clearly identified as reported H1 data or analytical estimates and should not be treated as audited FY26 full-year results.
Unlisted share prices are indicative and can vary materially between intermediaries. They are not equivalent to NSE/BSE market prices and may not represent an executable transaction price. Unlisted securities carry substantial risks including illiquidity, limited price discovery, valuation uncertainty, working-capital risk and possible loss of capital.
Past performance does not guarantee future results. Any IPO/listing should not be assumed unless officially announced and approved through the applicable regulatory process.
This report does not constitute investment advice, an offer, solicitation or recommendation to buy or sell securities.
For more such unlisted stocks visit https://unlistedcart.com/unlisted-shares/