Company Overview
Table Space Technologies Limited is an India-focused managed workspace and enterprise office solutions company, providing Grade-A office infrastructure primarily to large enterprises, Global Capability Centres (GCCs), Fortune 500 companies and multinational corporations.
Founded in 2017, the company operates an integrated Workspace-as-a-Service (WaaS) model covering leasing, office design, fit-outs, operations, facilities management and workplace services.
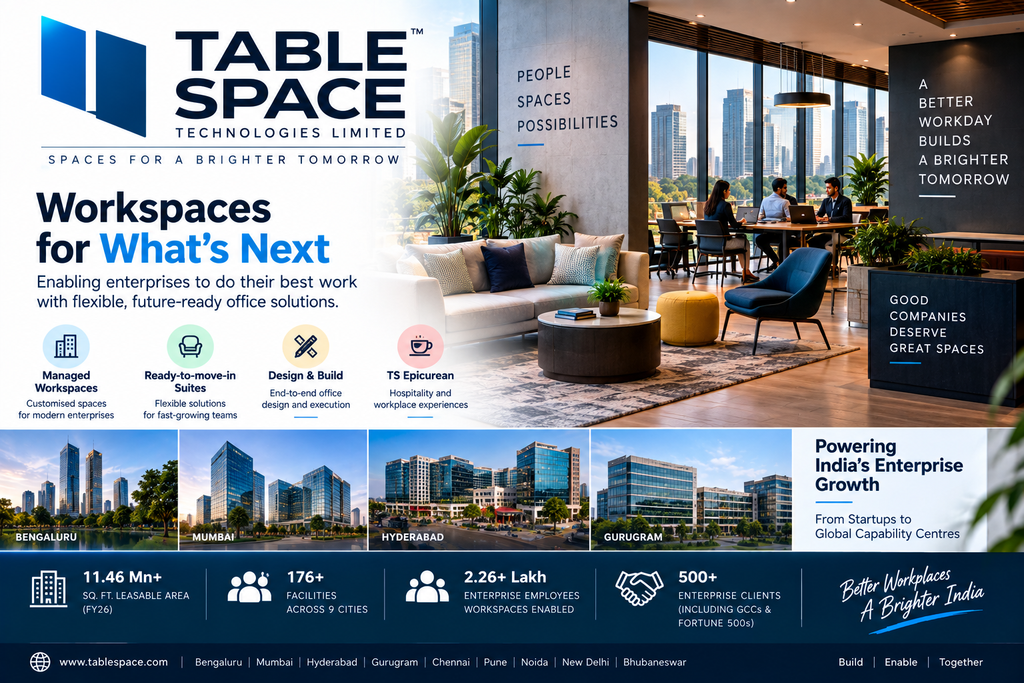
As of March 2026, Table Space had 11.46 million sq. ft. of leasable area, 11.42 million sq. ft. of operational area and 9.33 million sq. ft. of leased area across nine cities.
CIN: U74999KA2017PLC101040
Status: Unlisted Public Company
Headquarters: Bengaluru
Face Value: ₹1 per equity share
What Does Table Space Do?
Table Space provides fully managed office infrastructure to enterprises.
Instead of a company taking a conventional commercial property lease and separately managing:
- Interior design
- Construction and fit-outs
- Furniture
- IT infrastructure
- Facility management
- Security
- Housekeeping
- Compliance
- Food and hospitality
Table Space provides an integrated solution.
Its model effectively allows an enterprise to outsource a large part of its office infrastructure requirements to a single provider.
The company’s flagship offering consists of bespoke managed offices on long-term leases. It also offers ready-to-move-in Suites, design-and-build services and hospitality services through TS Epicurean.
Key Business Segments
1. Managed Workspaces
This is the company’s core business.
Table Space leases Grade-A commercial properties, undertakes the required fit-outs and provides fully managed office environments to enterprise customers.
FY2026 revenue from this segment was approximately ₹2,114.4 Cr.
2. Suites
Suites are premium ready-to-move-in offices aimed at companies requiring office space quickly without undertaking a lengthy fit-out process.
FY2026 revenue from Suites was approximately ₹361.9 Cr, compared with ₹66.3 Cr in FY2025.
3. Design & Build
Table Space has expanded into independent design-and-build mandates, allowing customers to use its design and execution capabilities even when the company is not providing the underlying managed-office lease.
4. TS Epicurean
The company also operates a hospitality and food-and-beverage vertical providing lifestyle and workplace amenities to occupiers.
Target Customers
Table Space primarily focuses on enterprise customers rather than traditional small coworking users.
Its customer base includes:
- Global Capability Centres
- Fortune 500 companies
- Multinational corporations
- Technology companies
- Banks
- Financial services companies
- Insurance companies
- Engineering and manufacturing companies
- Consulting and analytics companies
- Infrastructure and logistics businesses
The company’s DRHP states that the ten largest clients contributed approximately 35.62% of FY2026 revenue, compared with 32.08% in FY2025.
This provides significant enterprise scale, but also creates some customer-concentration risk.
Geographic Presence
As of March 2026, Table Space operated across nine Indian cities.
Key markets include:
- Bengaluru
- Mumbai Metropolitan Region
- Hyderabad
- Gurugram
- Chennai
- Pune
- Noida
- New Delhi
- Bhubaneswar
The company had 176 facilities across nine cities as of March 31, 2026.
The company has continued expanding its Hyderabad footprint during 2026, including a recently reported 5.06 lakh sq. ft. office lease.
Scale of Operations
| Metric | FY2024 | FY2025 | FY2026 |
|---|---|---|---|
| Leasable Area | 6.32 MSF | 9.93 MSF | 11.46 MSF |
| Operational Area | 6.12 MSF | 9.18 MSF | 11.42 MSF |
| Leased Area | 5.05 MSF | 7.30 MSF | 9.33 MSF |
| Committed Occupancy | 79.91% | 73.51% | 81.41% |
Source: Table Space DRHP.
The growth in leased area from 5.05 MSF in FY2024 to 9.33 MSF in FY2026 demonstrates the rapid expansion of the company’s operating footprint.
FY2026 Financial Performance
Table Space recorded strong growth in operating revenue during FY2026.
| Particulars | FY2024 | FY2025 | FY2026 |
|---|---|---|---|
| Revenue from Operations | ₹906.22 Cr | ₹1,360.47 Cr | ₹2,262.29 Cr |
| Normalised Revenue | ₹1,087.14 Cr | ₹1,583.96 Cr | ₹2,477.68 Cr |
| Facility Operating Profit | ₹292.54 Cr | ₹485.71 Cr | ₹823.64 Cr |
| Normalised EBITDA | ₹108.73 Cr | ₹202.26 Cr | ₹453.80 Cr |
| Normalised EBITDA Margin | 10.00% | 12.77% | 18.32% |
| PAT | ₹5.26 Cr | -₹1,554.11 Cr | -₹403.35 Cr |
| Net Debt | ₹283.56 Cr | ₹221.61 Cr | ₹452.15 Cr |
Source: Restated consolidated financial information in the DRHP.
Revenue Growth
Revenue from operations increased from:
₹906 Cr → ₹1,360 Cr → ₹2,262 Cr
between FY2024 and FY2026.
FY2026 revenue growth was approximately 66% YoY.
Normalised revenue grew 56.42% to ₹2,477.68 Cr.
EBITDA Growth
Normalised EBITDA increased from:
₹108.73 Cr in FY2024
to ₹202.26 Cr in FY2025
to ₹453.80 Cr in FY2026.
The normalised EBITDA margin increased from 10.0% to 18.32% over the same period.
This indicates improving operating economics as the company scales its workspace portfolio.
Profitability
Despite strong improvement in operating performance, Table Space reported a restated consolidated loss of ₹403.35 Cr in FY2026.
This was a substantial improvement compared with the ₹1,554.11 Cr loss in FY2025.
Therefore, an important distinction for investors is:
Operating profitability has improved sharply, but the company remained loss-making at the PAT level in FY2026.
The company reported FY2026 EBITDA of approximately ₹453.8 Cr on a normalised basis, while accounting for lease-related costs, depreciation, finance costs and other items results in a significant bottom-line loss.
Cash Flow
Table Space generated approximately ₹1,463.63 Cr of operating cash flow in FY2026.
This was compared with:
- ₹759.09 Cr in FY2025
- ₹475.12 Cr in FY2024
Investing cash flow was negative ₹724.93 Cr and financing cash flow was negative ₹687.17 Cr during FY2026.
The operating cash-flow profile is therefore an important positive operating metric despite the reported accounting loss.
Debt Position
Borrowings from banks and financial institutions stood at approximately:
- FY2024: ₹832.36 Cr
- FY2025: ₹669.18 Cr
- FY2026: ₹987.16 Cr
Net debt at March 2026 was approximately ₹452.15 Cr.
The proposed IPO specifically addresses this area, with the company planning to use up to ₹550 Cr of the fresh issue proceeds to repay/prepay borrowings.
Industry Opportunity
India’s managed and flexible workspace industry has expanded rapidly as enterprises increasingly seek:
- Flexible office commitments
- Faster office setup
- Grade-A infrastructure
- GCC expansion
- Lower initial fit-out burden
- Scalable office capacity
- Professionally managed workplaces
According to the CBRE report cited in Table Space’s DRHP, India’s Tier-1 flexible workspace stock was approximately 102–106 million sq. ft. at the end of 2025 and is projected to reach approximately 162–166 million sq. ft. by 2028, implying a CAGR of around 16–18%.
The DRHP also estimates the flexible-workspace addressable market at approximately 330–350 million sq. ft. and ₹980–1,365 billion of rental value by 2028.
GCC Opportunity
Global Capability Centres are a major structural driver for enterprise office demand in India.
The DRHP, citing CBRE, notes that India had more than 3,720 GCC units as of March 31, 2026.
Table Space specifically targets GCCs and multinational enterprises entering or expanding their India operations.
This provides a potential long-term demand driver because newly established GCCs often require:
- Large office footprints
- Grade-A properties
- Employee amenities
- Compliance
- Technology infrastructure
- Rapid deployment
Competitive Advantages
1. Enterprise-Focused Model
Table Space is focused heavily on large enterprises and GCCs rather than primarily targeting individual freelancers and small businesses.
2. Grade-A Portfolio
Approximately 98% of the leased area was located in Grade-A properties, according to the CBRE data cited in the DRHP.
3. Scale
The company had 9.33 million sq. ft. of leased area as of March 2026 and described itself as the largest operator among the benchmarked operators in the CBRE report.
4. High Occupancy
Committed occupancy stood at 81.41% in FY2026, up from 73.51% in FY2025.
For mature facilities, the company reported an occupancy rate of approximately 92.64%, according to CBRE data cited in the DRHP.
5. Integrated Service Offering
The company combines:
Lease + Design + Fit-out + Operations + Facility Management + Enterprise Services
This can simplify the office expansion process for large customers.
Major Shareholders
The DRHP’s fully diluted pre-offer shareholding shows the following major holders:
| Shareholder | Pre-Offer Holding |
|---|---|
| AGS TS II Holdings Pte. Ltd. | 41.76% |
| Karan Chopra | 12.47% |
| Kunal Mehra | 3.57% |
| KAM Advisors Pvt. Ltd. | 3.96% |
| Amit Mono Banerji | 22.14% |
| Bergamot Trust | 6.19% |
| Narendra Kumar Kamaraju | 4.05% |
AGS TS II Holdings is an investment-holding company ultimately associated with Hillhouse investment funds.
The DRHP also discloses that the 22.14% holding associated with the late Amit Mono Banerji is subject to ongoing legal proceedings, making this an important diligence point for investors.
Promoters & Management
The DRHP identifies the following promoters:
- Karan Chopra
- Kunal Mehra
- Sarita Banerji
- KAM Advisors Private Limited
- AGS TS II Holdings Pte. Ltd.
Karan Chopra
Karan Chopra is Chairman, Whole-time Director and Co-Chief Executive Officer.
He oversees overall strategy, business delivery and key stakeholder relationships.
Kunal Mehra
Kunal Mehra is President, Whole-time Director and Co-Chief Executive Officer.
He oversees strategy, business delivery, new business development and leasing.
Both founders have backgrounds in commercial real estate and hospitality.
IPO Status
Table Space Technologies filed its Draft Red Herring Prospectus (DRHP) with SEBI in August 2026.
SEBI’s filing is dated August 18, 2026.
The proposed IPO consists of:
Fresh Issue
Up to ₹800 Cr.
Offer for Sale
Up to 65,475,432 equity shares, or approximately 6.55 Cr shares, by existing shareholders.
The principal selling shareholder is AGS TS II Holdings Pte. Ltd., which proposes to sell up to approximately 4.98 Cr shares.
Other selling shareholders include Karan Chopra, Kunal Mehra and other existing shareholders.
Proposed Use of Fresh Issue
Up to ₹550 Cr is proposed to be used for repayment/prepayment of borrowings.
The remaining proceeds are proposed for:
- Inorganic growth
- Unidentified acquisitions
- General corporate purposes
The company may also undertake a pre-IPO placement of up to ₹160 Cr, which would be adjusted against the fresh issue if completed.
Proposed Listing
The DRHP proposes listing on:
- BSE
- NSE
No IPO price band or issue dates had been fixed in the August 2026 DRHP.
Therefore, as of 23 September 2026, Table Space remains unlisted and the IPO is still at the draft-offer-document stage.
Why Table Space Could Be Interesting for Unlisted Investors
1. Exposure to India’s Growing Managed Office Market
Managed and flexible workspace adoption is increasing as companies seek more flexibility in office commitments.
2. GCC Tailwind
India continues to attract multinational companies establishing and expanding GCCs.
Table Space specifically targets this enterprise segment.
3. Rapid Scale-Up
Leased area increased from 5.05 MSF in FY2024 to 9.33 MSF in FY2026.
4. Improving EBITDA
Normalised EBITDA increased more than twofold in FY2026 to approximately ₹454 Cr, while the margin expanded to 18.32%.
5. Potential Deleveraging
If the proposed IPO is completed as currently outlined, up to ₹550 Cr could be used for debt repayment.
That could reduce finance costs and improve the balance sheet.
Key Risks
1. Lease Liability & Fixed-Cost Risk
The managed workspace model requires Table Space to commit to long-term leases.
If occupancy falls significantly, rental obligations can continue while revenue declines.
2. Customer Concentration
The top ten customers contributed approximately 35.62% of FY2026 operating revenue.
Loss or downsizing by a major customer could therefore affect revenue.
3. High Capital Requirements
Expansion requires substantial spending on:
- Security deposits
- Fit-outs
- Technology
- Furniture
- Infrastructure
- New centres
4. Continued Net Losses
Although losses narrowed considerably, Table Space still reported a ₹403 Cr FY2026 loss.
Investors should therefore focus on the path from operating EBITDA to sustainable PAT and free cash flow.
5. Real Estate Market Risk
The business depends on the availability and pricing of Grade-A commercial properties in India’s major office markets.
Rental inflation could pressure margins if customer pricing cannot increase proportionately.
6. Competition
The managed-office industry includes players such as:
- Smartworks
- Awfis
- Indiqube
- WeWork India
- Other flexible-office operators
7. Legal / Shareholding Risk
The DRHP specifically discloses ongoing legal proceedings related to the 22.14% disputed shareholding associated with the late Amit Mono Banerji.
This should be monitored as part of unlisted-share due diligence.
Investment Perspective
Table Space provides exposure to the intersection of:
Commercial Real Estate + Managed Offices + GCC Expansion + Enterprise Services + Flexible Workspace.
The company’s operating metrics show rapid expansion:
11.46 MSF leasable area
9.33 MSF leased area
₹2,262 Cr FY2026 operating revenue
₹454 Cr normalised EBITDA
81.41% committed occupancy
The key investment question is not simply whether India’s managed-office market will grow, but whether Table Space can convert its expanding footprint into sustainable cash earnings while controlling lease obligations, debt and customer concentration.
The proposed IPO is also significant because a substantial portion of the fresh capital is intended for debt reduction.
For an unlisted investor, the purchase price, implied valuation, liquidity, transferability and eventual IPO pricing should be evaluated carefully rather than assuming that the proposed IPO automatically establishes a future valuation.
Company Snapshot
| Particular | Details |
|---|---|
| Company | Table Space Technologies Limited |
| CIN | U74999KA2017PLC101040 |
| Founded | 2017 |
| Industry | Managed Workspace / Commercial Real Estate |
| Status | Unlisted Public Company |
| Headquarters | Bengaluru |
| Promoters | Karan Chopra, Kunal Mehra, Sarita Banerji, KAM Advisors, AGS TS II Holdings |
| FY2026 Revenue | ₹2,262.29 Cr |
| FY2026 Normalised Revenue | ₹2,477.68 Cr |
| FY2026 Normalised EBITDA | ₹453.80 Cr |
| FY2026 EBITDA Margin | 18.32% |
| FY2026 PAT | -₹403.35 Cr |
| FY2026 Net Debt | ₹452.15 Cr |
| Leasable Area | 11.46 MSF |
| Leased Area | 9.33 MSF |
| Operational Area | 11.42 MSF |
| Committed Occupancy | 81.41% |
| Cities | 9 |
| Facilities | 176 |
| Proposed Fresh Issue | Up to ₹800 Cr |
| Proposed OFS | Up to 6.55 Cr shares |
| Proposed Debt Repayment | Up to ₹550 Cr |
| Proposed Exchanges | NSE & BSE |
| IPO Status | DRHP filed; price band/date not announced |
Important Links
Table Space Official Website
Table Space
Table Space Investor Relations
Table Space Investor Relations
Table Space About / Company Profile
About Table Space
SEBI – Table Space Technologies DRHP
SEBI – Table Space Technologies DRHP
SEBI – Draft Abridged Prospectus
Table Space Draft Abridged Prospectus
Disclaimer
This report is for informational and educational purposes only and should not be considered investment advice, an offer to buy or sell securities, or a guarantee of returns.
Unlisted securities involve higher risks including limited liquidity, limited price discovery, valuation uncertainty, transfer restrictions, lack of an established public market and uncertainty regarding IPO/listing timelines.
Financial figures and company information have been compiled from the company’s official disclosures, SEBI filings, the DRHP and other publicly available sources. IPO size, price band, valuation, timing and listing plans may change. Investors should independently verify the latest company and regulatory disclosures before making any investment decision.
For more such unlisted stocks visit