Company: SAN Engineering and Locomotive Company Limited
CIN: U74210KA1973PLC002424
ISIN: INE031H01012
Face Value: ₹10
Incorporated: 3 October 1973
Registered Office: Whitefield Road, Bengaluru, Karnataka
Status: Active Unlisted Public Company
Industry: Railway Equipment / Industrial Engineering / Power Transmission
Official Website: SAN Engineering & Locomotive Company Limited
Official Investor / Annual Reports Page: SAN Engineering Investor Details
Executive Summary
SAN Engineering and Locomotive Company Limited, commonly known as SAN Engineering, is a Bengaluru-based engineering company with roots going back to 1969 and the present corporate entity incorporated in 1973.
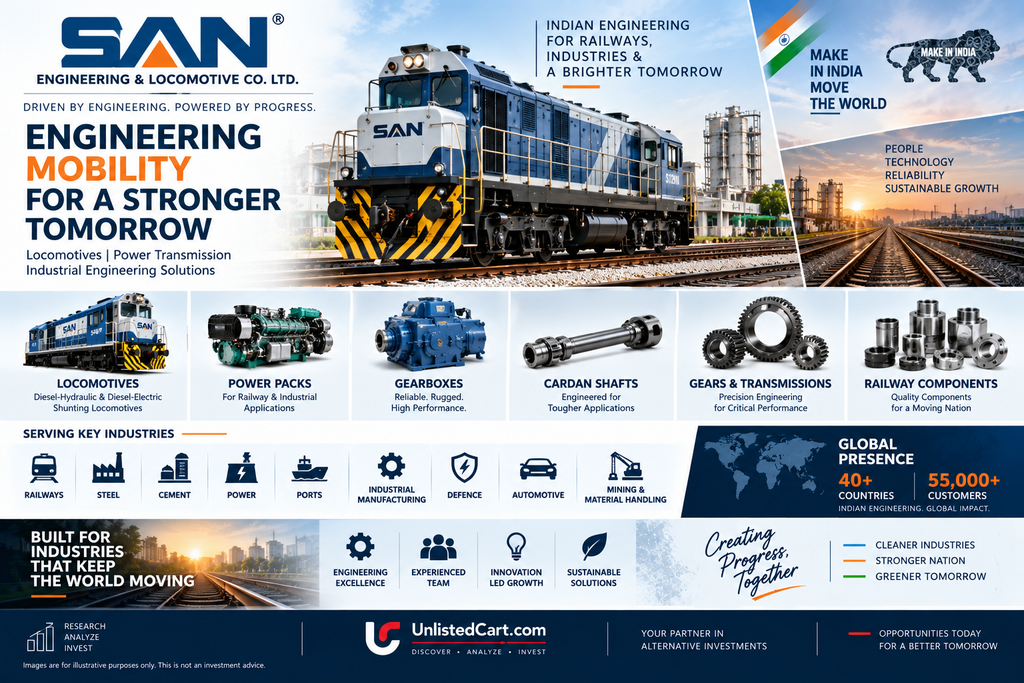
The company started as a locomotive manufacturer and has evolved into a diversified engineering business covering:
- Diesel-hydraulic locomotives
- Diesel-electric locomotives
- Power packs
- Gearboxes
- Turbo reversing transmissions
- Cardan shafts
- Gears
- Railway components
- Industrial transmission solutions
The company states that its products are used across railway, industrial and other heavy-engineering applications. Its website highlights diesel-hydraulic shunting locomotives powered by Cummins or Caterpillar engines, with hydrodynamic transmissions engineered by Voith and manufactured by SAN in India.
The FY2026 financial picture is mixed.
FY2026 consolidated numbers
- Revenue from operations: ₹295.59 Cr
- Total income: ₹298.82 Cr
- EBITDA: approximately ₹33.19 Cr
- PBT: ₹26.73 Cr
- PAT: ₹19.93 Cr
- EPS: ₹44.80
- Operating cash flow: ₹28.45 Cr
- Net worth: approximately ₹303.95 Cr
- Total assets: ₹361.54 Cr
- Cash & cash equivalents: ₹10.98 Cr
- Investments: ₹17.45 Cr
FY2026 revenue grew around 11.4%, but PAT fell sharply because FY2025 benefited from a ₹25.05 Cr exceptional gain on sale of property, plant and equipment and FY2026 did not have that benefit.
At an indicative unlisted price of around ₹850/share, the company has an implied market capitalisation of approximately ₹378 Cr. The FY2026 P/E based on reported EPS of ₹44.80 is approximately 19x, while P/B is approximately 1.25x using the reported book value of about ₹680/share.
The key investment question is therefore not simply whether SAN is a profitable engineering company. It is whether future growth in locomotives, railway equipment, power packs and transmission products can restore margins and ROCE after the FY2026 earnings decline.
Company Overview
SAN Engineering has a long operating history in Indian engineering.
The company describes itself as a manufacturer of:
locomotives, power packs, gearboxes, cardan shafts and technologically advanced rail products.
Its official website states that the company has developed products using experienced engineering teams and has built capabilities across design, manufacturing and customer support.
Company website: Visit SAN Engineering’s official website
History
SAN began as a locomotive manufacturing business in 1969.
Over time, it diversified from locomotives into:
- Power packs
- Gearboxes
- Transmission systems
- Cardan shafts
- Gears
- Railway equipment
- Industrial machinery components
The company’s evolution from a locomotive manufacturer into a multi-product engineering business is an important part of the investment thesis.
Current unlisted-market sources also describe SAN as a multi-product, multi-market engineering company with capabilities in locomotives, transmissions, gearboxes and power packs.
Business Model
SAN operates primarily as a B2B engineering manufacturer.
The company designs, manufactures and supplies specialised mechanical and railway equipment rather than selling standard consumer products.
Its business can broadly be divided into four areas.
1. Locomotives
SAN manufactures:
- Diesel-hydraulic shunting locomotives
- Diesel-electric locomotives
- Industrial locomotives
The company focuses particularly on shunting locomotives, which are used for moving wagons and material within industrial facilities, ports, steel plants and other locations.
2. Power Packs
SAN manufactures power-pack solutions for applications including:
- Railway vehicles
- Overhead equipment cars
- Self-propelled vehicles
- Cranes
- Specialised industrial applications
3. Gearboxes & Transmissions
This is an important diversification area.
The company’s gearbox products have applications across:
- Steel
- Cement
- Sugar
- Power plants
- Industrial machinery
- Defence-related equipment
- Material handling
The company also manufactures turbo reversing transmissions and heavy-duty cardan shafts.
4. Railway Components
SAN also manufactures components and systems for railway vehicles.
This provides exposure to the broader railway-equipment ecosystem rather than only locomotive sales.
Product Portfolio
Diesel-Hydraulic Locomotives
SAN’s website highlights locomotives powered by Cummins or Caterpillar engines combined with hydrodynamic transmissions engineered by Voith and manufactured by SAN in India.
Diesel-Electric Locomotives
The company also offers diesel-electric solutions for industrial and railway applications.
Power Packs
Power packs are designed for specialised railway and industrial equipment.
Gearboxes
SAN manufactures gearboxes for a variety of industrial applications.
Historical company information indicates applications ranging from:
- Battle tanks
- Steel mills
- Sugar plants
- Cement plants
- Conveyors
- Power plants
This diversification makes the gearbox business particularly relevant because it reduces dependence on locomotive sales.
Cardan Shafts
Heavy-duty cardan shafts are used for transmitting mechanical power in industrial applications.
Manufacturing Capabilities
SAN operates manufacturing facilities equipped with high-precision CNC machining capabilities.
Current company information describes two manufacturing plants, supported by:
- CNC horizontal machining centres
- CNC vertical machining centres
- Gear manufacturing
- Precision machining
- Testing capabilities
The company also states that it has more than 500 employees, including more than 200 sales and service engineers, a 40-member R&D/product-development team, and qualified engineering personnel on the shop floor.
Company people / engineering information: SAN Engineering – Our People
Technology & Engineering
SAN’s competitive positioning is based significantly on engineering capability.
The company says it focuses on:
- Product development
- Engineering design
- R&D
- Strategic technology partnerships
- Customer-specific solutions
- Product reliability
- Lifecycle support
Its locomotive products combine engines from global manufacturers with transmission technology and SAN’s own manufacturing capabilities.
This combination can create entry barriers compared with simple fabrication businesses.
Industry Opportunity
Indian Railway Modernisation
India’s railway ecosystem is undergoing significant modernisation and expansion.
Demand exists across:
- Locomotives
- Railway components
- Maintenance equipment
- Shunting systems
- Power packs
- Transmission systems
SAN is positioned more toward specialised railway and industrial equipment rather than being a direct play on passenger-train manufacturing.
Industrial Automation
Large industrial facilities increasingly require specialised internal logistics and material movement.
Industrial locomotives can be used within:
- Steel plants
- Ports
- Cement plants
- Mining facilities
- Manufacturing plants
This provides a second demand pool beyond Indian Railways.
Defence & Heavy Engineering
SAN’s gearbox and transmission capabilities potentially provide opportunities in defence and heavy engineering.
The company’s products have historically been used across specialised industrial and defence-related applications.
Replacement Market
A significant advantage of industrial equipment is that customers eventually require:
- Replacement
- Maintenance
- Spare parts
- Overhauling
- Upgrades
This can provide recurring revenue beyond new equipment sales.
Financial Performance
Consolidated Financials
| ₹ Crore | FY23 | FY24 | FY25 | FY26 |
|---|---|---|---|---|
| Revenue | 200.40 | 226.00 | 265.34 | 295.59 |
| Total Income | — | — | 268.97 | 298.82 |
| EBITDA* | ~30 | ~40 | ~44.90 | ~33.19 |
| PBT | 25.22 | ~37 | 63.29 | 26.73 |
| PAT | 18.70 | ~28 | 49.86 | 19.93 |
| EPS | 42.70 | 62.92 | 112.04 | 44.80 |
*Approximate EBITDA calculated using PBT + finance cost + depreciation where required.
FY2026 revenue increased from ₹265.34 Cr to ₹295.59 Cr, an increase of approximately 11.4%. However, PAT fell from ₹49.86 Cr to ₹19.93 Cr.
Why Did PAT Fall So Much?
This is one of the most important points in the report.
FY2025 included:
₹25.05 Cr exceptional gain from sale of property, plant and equipment.
FY2026 did not have this gain.
Therefore, comparing FY2026 PAT directly with FY2025 without adjusting for the exceptional gain can give an exaggerated impression of operating deterioration.
A more useful metric is:
FY2025 PBT before exceptional item
Approximately:
₹38.24 Cr
FY2026 PBT
₹26.73 Cr
This still represents a decline, but the underlying decline is much smaller than the headline PAT decline.
Therefore:
FY2026 was weaker operationally, but the 60%+ PAT decline is partly due to the absence of the FY2025 property-sale gain.
EBITDA Margin
Approximate EBITDA:
FY25
~₹44.9 Cr
Revenue:
₹265.34 Cr
EBITDA margin:
~16.9%
FY26
~₹33.2 Cr
Revenue:
₹295.59 Cr
EBITDA margin:
~11.2%
This indicates genuine operating-margin pressure.
Third-party financial databases report FY26 EBITDA around ₹30.7 Cr and operating margin around 10.39%, depending on their EBITDA methodology.
Therefore, the key issue for FY27 is margin recovery.
Balance Sheet
FY26 consolidated balance sheet:
| Particulars | FY26 |
|---|---|
| Total Assets | ₹361.54 Cr |
| Equity Share Capital | ₹4.45 Cr |
| Other Equity | ₹299.50 Cr |
| Total Equity | ~₹303.95 Cr |
| PPE | ₹74.88 Cr |
| CWIP | ₹0.42 Cr |
| Inventory | ₹73.82 Cr |
| Trade Receivables | ₹147.64 Cr |
| Investments | ₹17.45 Cr |
| Cash | ₹10.98 Cr |
| Other Bank Balances | ₹11.11 Cr |
Debt Position
One of the attractive features of SAN’s current balance sheet is its relatively low financial debt.
FY26 finance cost was only:
₹0.65 Cr
against revenue of ₹295.59 Cr.
The company therefore does not appear to have a significant conventional interest-bearing debt burden at the consolidated level.
However, MCA-related records show open charges of ₹177.5 Cr with State Bank of India, so investors should distinguish between registered security charges and actual outstanding borrowings. A charge can remain on the MCA record even when the underlying utilisation or balance differs.
This should be verified against the latest audited borrowing schedule before investment.
Working Capital
The major balance-sheet concern is receivables.
FY26:
Trade receivables = ₹147.64 Cr
against revenue:
₹295.59 Cr
Therefore, receivables represent approximately half of annual revenue.
This is significant.
The company did, however, improve its receivables turnover ratio from 169x to 177x according to the reported ratio table.
Inventory declined:
₹93.62 Cr → ₹73.82 Cr
This helped operating cash flow substantially.
Cash Flow Analysis
FY2026 operating cash flow:
₹28.45 Cr
FY2025:
-₹28.30 Cr
This represents a significant improvement.
The improvement was primarily driven by:
- ₹19.80 Cr reduction in inventory
- Better working-capital movement
- Improved cash conversion
However, the company spent approximately:
₹36.66 Cr on PPE
during FY2026.
Consequently:
Investing cash flow = -₹20.25 Cr
The capex indicates continued investment in manufacturing capacity and equipment.
Return Ratios
FY2026 reported:
- ROE: 6.35%
- ROCE: 6.48%
- ROI: 5.21%
- Net profit margin: 6.46%
FY2025:
- ROE: 18.57%
- ROCE: 18.91%
- Net profit margin: 18.42%
The sharp fall in return ratios is a key monitorable.
However, FY2025 was boosted by the exceptional property-sale gain, so FY2025 ROE/ROCE should not be treated as a normalised recurring benchmark.
Dividend
SAN has historically paid dividends.
The FY2025 AGM notice proposed:
₹10/share dividend
for FY2024-25.
The FY2026 cash-flow statement shows:
₹4.45 Cr dividend paid
which is consistent with a ₹10/share dividend on approximately 44.5 lakh shares.
At an indicative ₹850 share price, the ₹10 dividend represents a historical yield of approximately:
1.18%
The yield is not the main investment thesis; capital appreciation and earnings growth are more important.
Shareholding
Current FY26 shareholding reported by unlisted-market sources is:
| Shareholder | Holding |
|---|---|
| Milind S. Thakker | 45.02% |
| Sonmil Engineering Pvt Ltd | 34.43% |
| Importex International Pvt Ltd | 9.33% |
| Anjana M. Thakker | 6.71% |
| Others | 4.51% |
Promoter and promoter-related ownership is therefore highly concentrated.
This creates strong ownership alignment but also contributes to limited free float and low liquidity.
Management
Milind S. Thakker
Chairman
The company has reported more than three decades of management experience associated with the leadership.
Ramanathan Narayanan
Managing Director & CEO
He is reported to have more than 40 years of experience.
The current board also includes professional/independent directors including Jasjiv Sahney, Shiv Dayal and Yash Gupta according to available company records.
Subsidiaries
SAN Engineering has two principal subsidiaries:
SAN Motors Limited
CIN:
U34103KA1997PLC101338
SAN Motors is an automotive/auto-components subsidiary of SAN Engineering. Publicly available MCA information identifies it as an active subsidiary.
SAN Rolling Stock Services Limited
CIN:
U74999KA2017PLC102366
The company is part of the SAN group structure and focuses on rolling-stock-related activities.
The official SAN investor page provides separate financial statements for both subsidiaries.
Official subsidiary financial statements: SAN Investor – Subsidiary Financial Statements
Engineering & R&D
SAN states that it has:
- 40-member R&D/product-development team
- 200+ sales and service engineers
- Qualified shop-floor engineers
- Internal training programme
- Continuous product development
This is important because the company’s competitive advantage is primarily engineering capability rather than scale manufacturing alone.
Competitive Advantages
1. Long Operating History
The business has been associated with locomotive manufacturing since 1969.
2. Engineering Capability
SAN designs and manufactures locomotives, transmissions, gearboxes and power packs.
3. Diversified Applications
Products are used in:
- Railways
- Steel
- Cement
- Sugar
- Power
- Ports
- Industrial machinery
- Defence-related applications
4. Technology Partnerships
The company’s locomotive ecosystem includes technology/components associated with global names such as Cummins, Caterpillar and Voith.
5. Low Financial Leverage
FY26 finance costs were only ₹0.65 Cr.
6. Strong Liquidity
Current ratio was approximately 4.97x in FY26.
7. Promoter Ownership
Promoter/promoter-related ownership is highly concentrated.
Growth Drivers
Railway Infrastructure
Continued investment in railway infrastructure can create opportunities for specialised equipment and components.
Industrial Shunting
Steel plants, ports, manufacturing facilities and other industrial complexes require locomotives for internal movement.
Power Transmission
Gearboxes and transmission products can provide a diversified revenue stream.
Defence
Specialised transmission and gear products can potentially address defence applications.
Export Markets
Engineering products can be exported where SAN has suitable certifications and customer relationships.
After-Sales
Service and replacement parts can create recurring revenue from installed equipment.
Key Risks
1. FY26 Margin Compression
Revenue grew 11%, but EBITDA declined significantly.
This is currently the most important operating issue.
2. High Receivables
Trade receivables of ₹147.64 Cr against revenue of ₹295.59 Cr require monitoring.
3. Project/Tender Cyclicality
Large industrial and railway orders can be uneven, causing quarter-to-quarter volatility.
4. Customer Concentration
Specialised engineering companies can have substantial dependence on a limited number of customers.
5. Raw-Material Costs
Steel and other engineering materials influence margins.
6. Working-Capital Requirements
Large orders may require inventory and receivable funding before cash is collected.
7. Unlisted Liquidity
There is no continuous NSE/BSE price discovery.
8. Valuation Risk
At ₹850, the company is not trading at a deep discount based on FY26 earnings.
Current Unlisted Share Price
As of September 2026, different platforms show materially different indicative prices.
UnlistedZone
₹850/share
as of 10 September 2026.
Indicative market capitalisation:
₹378 Cr
Shares:
44.50 lakh
Lot size:
50 shares
The platform explicitly states that its price is indicative and not a live exchange quote or offer to deal.
Current indicative reference: SAN Engineering – UnlistedZone
Neoma Capital
₹841.50/share
as of 10 September 2026.
The platform reports market capitalisation of approximately ₹374.47 Cr.
Current indicative reference: SAN Engineering – Neoma Capital
Because this is an unlisted security, these prices should be treated as indicative OTC references rather than exchange-traded market prices.
Current Valuation
At ₹850/share:
Shares outstanding:
44.50 lakh
Implied market capitalisation:
₹378.25 Cr
FY2026 EPS
₹44.80
Therefore:
P/E ≈ 19.0x
Book Value
Approximately:
₹680/share
Therefore:
P/B ≈ 1.25x
The reported third-party valuation data broadly supports a book value around ₹680/share and P/B around 1.25x.
Valuation Sensitivity
Using FY2026 EPS of ₹44.80:
| P/E Multiple | Implied Value |
|---|---|
| 10x | ₹448 |
| 12x | ₹538 |
| 14x | ₹627 |
| 16x | ₹717 |
| 18x | ₹806 |
| 20x | ₹896 |
| 22x | ₹986 |
| 25x | ₹1,120 |
At approximately ₹850, the market is effectively valuing the company around 19x FY26 earnings.
This means future earnings recovery is important.
Normalised Earnings Approach
FY2025 included a ₹25.05 Cr exceptional property-sale gain.
Therefore, FY2025 reported PAT of ₹49.86 Cr is not an appropriate standalone measure of recurring earnings.
FY2026 PAT of ₹19.93 Cr is therefore a more conservative current earnings base.
If FY27 earnings recover to:
₹25 Cr PAT
EPS would be approximately:
₹56/share
At 15x:
₹840/share
At 18x:
₹1,008/share
₹30 Cr PAT
EPS:
₹67.4/share
At 15x:
₹1,011/share
At 18x:
₹1,213/share
These are scenario calculations, not forecasts.
What Needs to Improve
For the valuation to become more compelling, investors should monitor whether SAN can achieve:
1. EBITDA margin recovery
From ~10–11% currently toward the mid-teens.
2. PAT recovery
From ₹19.9 Cr toward ₹25–30 Cr+.
3. Receivables control
₹147.6 Cr receivables need to remain under control as revenue grows.
4. Higher asset utilisation
FY26 PPE increased significantly to ₹74.88 Cr following ₹36.66 Cr of capex.
5. Stronger ROCE
FY26 ROCE of 6.48% is significantly below FY25’s reported 18.91%.
IPO / Listing Status
SAN Engineering is currently unlisted.
Available unlisted-market data indicates:
DRHP filed: No
There is no confirmed IPO date that should be assumed as a valuation catalyst.
Investors should therefore evaluate SAN primarily on business fundamentals rather than buying solely on expectations of a future IPO.
Investment Framework
Business Quality
The company has a differentiated engineering franchise with:
- Long operating history
- Locomotive manufacturing
- Transmission expertise
- Gearbox manufacturing
- Power-pack capabilities
- Industrial applications
- R&D capability
- Service infrastructure
Balance Sheet
The balance sheet is relatively comfortable:
- Current ratio ~4.97x
- Low finance cost
- ₹28.45 Cr operating cash flow
- ₹303.95 Cr consolidated equity
Earnings
FY26 earnings were significantly below FY25, although FY25 contained an exceptional gain.
The key issue is therefore normalised profitability.
Valuation
At ₹841–850:
P/E ~18.8–19.0x FY26
P/B ~1.24–1.25x
This is not an obviously distressed valuation.
Overall Assessment
SAN Engineering is an interesting niche industrial-engineering business with exposure to railway equipment, industrial locomotives, gearboxes, power packs and mechanical transmissions.
Its strengths include:
- Long engineering history
- Specialised products
- Diverse industrial applications
- Strong technical capability
- Low financial-cost burden
- Healthy liquidity
- Positive FY26 operating cash flow
- High promoter ownership
- Potential railway/industrial infrastructure tailwinds
However, FY26 highlighted important concerns:
- EBITDA margin compressed
- PAT fell substantially
- ROE and ROCE declined
- Receivables remain high
- Significant capex was required
- Unlisted liquidity remains limited
The ₹25.05 Cr exceptional property-sale gain in FY25 is particularly important. It means the FY25 ₹49.86 Cr PAT should not be used mechanically to calculate a normalised P/E.
At around ₹850, the company trades around 19x FY26 earnings and 1.25x book value.
The valuation becomes more interesting if SAN can demonstrate:
Revenue growth + margin recovery + higher ROCE + controlled receivables.
The next two or three years should therefore be evaluated on earnings quality rather than only revenue growth.
Key Numbers at a Glance
| Metric | FY2026 |
|---|---|
| Revenue | ₹295.59 Cr |
| Total Income | ₹298.82 Cr |
| EBITDA* | ~₹33.19 Cr |
| PBT | ₹26.73 Cr |
| PAT | ₹19.93 Cr |
| EPS | ₹44.80 |
| Net Worth | ~₹303.95 Cr |
| Total Assets | ₹361.54 Cr |
| Trade Receivables | ₹147.64 Cr |
| Inventory | ₹73.82 Cr |
| Investments | ₹17.45 Cr |
| Cash | ₹10.98 Cr |
| Operating Cash Flow | ₹28.45 Cr |
| Current Ratio | 4.97x |
| ROE | 6.35% |
| ROCE | 6.48% |
| Indicative Price | ~₹842–850 |
| Market Cap | ~₹374–378 Cr |
| FY26 P/E | ~18.8–19.0x |
| P/B | ~1.25x |
| IPO/DRHP | Not filed |
| Listing Status | Unlisted |
*Approximate EBITDA based on reported PBT, finance costs and depreciation.
Important Links & Due-Diligence Sources
Company
SAN Engineering & Locomotive – Official Website
Use this for the company’s product portfolio, manufacturing capabilities, corporate information and contact details.
Annual Reports & Investor Information
SAN Engineering – Official Investor Page
The official investor page provides annual reports, subsidiary financial statements, annual returns and IEPF-related shareholder information.
FY2024–25 Annual Report
SAN Engineering FY2024–25 Annual Report
The FY25 annual report includes the audited standalone and consolidated financial statements and the dividend proposal of ₹10/share.
FY2026 Financial Reference
SAN Engineering FY2026 Financials – WWIPL
Useful for FY26 consolidated P&L, balance sheet, cash flow and ratio data.
Current Indicative Unlisted Price
SAN Engineering – UnlistedZone
The September 2026 reference is around ₹850/share and the platform explicitly labels the price as indicative.
Alternative Price Reference
SAN Engineering – Neoma Capital
The September 2026 reference is around ₹841.50/share.
Disclaimer
This report is prepared for research and informational purposes only and should not be considered investment advice, a recommendation to buy or sell securities, or a guarantee of future returns.
SAN Engineering is an unlisted security, and the prices quoted by intermediaries are indicative OTC references rather than continuous exchange-traded prices. Different intermediaries may quote materially different prices.
Financial figures should be independently verified against the latest audited company documents before executing any transaction. In particular, investors should verify the latest FY2026 annual report, shareholding, outstanding borrowings, receivables, related-party transactions, share-transfer documentation and current executable price.
For more such unlisted stocks visit https://unlistedcart.com/unlisted-shares/