Report Date: September 2026
Industry: Power Exchange / Electricity Markets
Status: Unlisted Public Company
Former Name: Pranurja Solutions Limited
CIN: U74999MH2018PLC308448
Face Value: ₹1 per Equity Share
ISIN: INE07WD01012
Company Overview
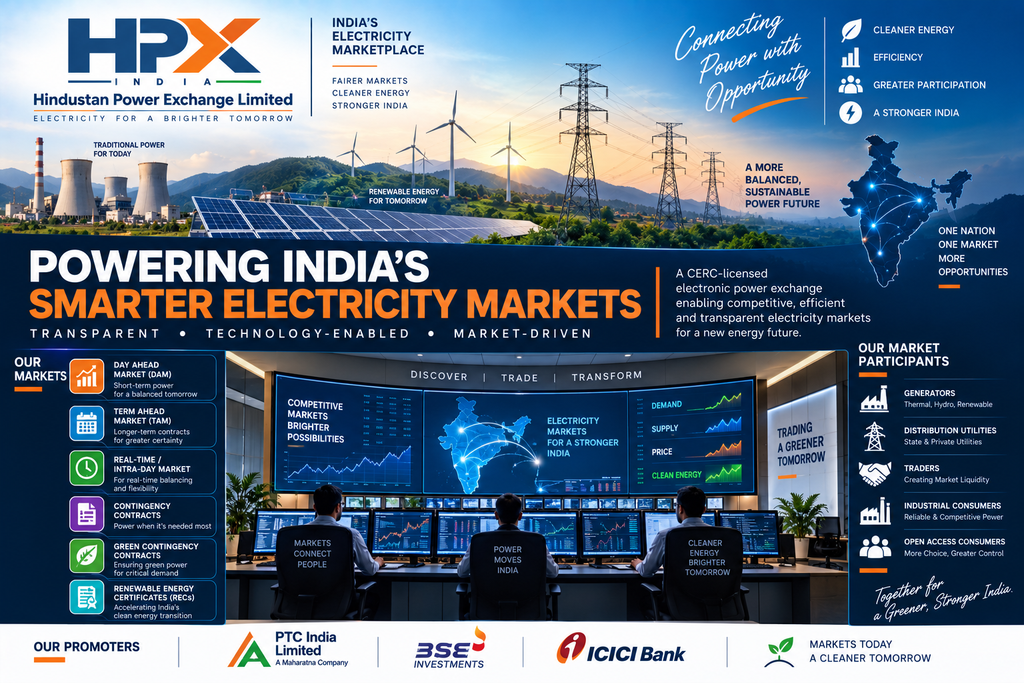
Hindustan Power Exchange Limited (HPX) is India’s third power exchange and provides an electronic marketplace for trading electricity and electricity-related products.
The company was incorporated in 2018 as Pranurja Solutions Limited by a consortium involving PTC India Limited, BSE Investments Limited and ICICI Bank Limited. It subsequently changed its name to Hindustan Power Exchange Limited.
HPX received approval from the Central Electricity Regulatory Commission (CERC) and commenced operations on 6 July 2022.
HPX’s registered office is at P. J. Towers, Dalal Street, Mumbai, while its corporate office is located at World Trade Tower, Noida.
Business Model
HPX operates as an electronic electricity marketplace.
Unlike conventional power generators, HPX does not primarily generate or transmit electricity. Instead, it provides the trading infrastructure through which buyers and sellers can transact electricity and related market products.
The company’s revenue is primarily linked to:
- Transaction fees
- Membership-related income
- Market-related services
- Investment income on surplus funds
- Other exchange-related services
The business is therefore highly dependent on trading volumes, liquidity, number of participants, transaction fees and market share.
Products and Markets
HPX provides access to multiple electricity-market segments.
Day-Ahead Market – DAM
DAM allows participants to buy and sell electricity for delivery on the following day.
Real-Time Market – RTM
RTM facilitates electricity transactions closer to the actual delivery period and helps market participants manage demand and supply imbalances.
Term-Ahead Market – TAM
TAM allows participants to transact electricity for periods extending beyond the immediate day-ahead market.
This segment has been particularly important for HPX’s growth.
Green Day-Ahead Market – GDAM
GDAM facilitates trading of renewable electricity.
Green Term-Ahead Market – GTAM
GTAM provides longer-duration trading opportunities for renewable energy.
High Price Markets
HPX also participates in high-price market segments designed to facilitate transactions under specific market conditions.
Long Duration Contracts
HPX has developed longer-duration electricity contracts, providing market participants with greater flexibility in managing their power requirements.
Energy Certificates
The exchange also facilitates trading in Renewable Energy Certificates (RECs) and other market instruments permitted under the applicable regulatory framework.
The Ministry of Power confirms that India’s power exchanges provide markets including DAM, TAM, RTM, Renewable Energy Certificates and Energy Saving Certificates.
Promoters and Shareholding
HPX was established by three major institutional shareholders:
| Shareholder | Shares | Approx. Holding |
|---|---|---|
| PTC India Limited | 12.50 Cr | 22.62% |
| BSE Investments Limited | 12.50 Cr | 22.62% |
| ICICI Bank Limited | 4.995 Cr | 9.04% |
| Other shareholders | ~25.255 Cr | ~45.72% |
| Total | 55.25 Cr | 100% |
The latest regulatory proceedings available indicate that PTC India continued to hold 22.62% of HPX as of September 30, 2025.
The three principal institutional shareholders together accounted for approximately 54.28% of HPX based on the disclosed shareholding structure.
Institutional Backing
The ownership structure gives HPX exposure to three established institutions:
PTC India provides significant experience in India’s electricity-trading ecosystem.
BSE Investments brings the experience and infrastructure associated with the BSE financial-market ecosystem.
ICICI Bank provides institutional and financial-market expertise.
The combination gives HPX a strong institutional shareholder base despite being a relatively young exchange.
Evolution of HPX
HPX began commercial operations in July 2022.
The company’s early years involved significant investment in technology, employees, market development and participant onboarding.
FY2022-23
HPX generated total revenue of approximately ₹17.44 crore and reported a loss of approximately ₹10.01 crore.
FY2023-24
HPX achieved a significant turnaround.
Total revenue increased to approximately ₹43.63 crore, while PAT reached approximately ₹14.93 crore compared with a loss of ₹10.01 crore in FY2023.
The company also reported approximately 11 billion units (11 BU) of traded volume during FY2023-24 and captured close to one-third of the Term-Ahead Market in that period.
FY2024-25 Financial Performance
HPX’s FY2024-25 financial statements show a moderation in revenue and profitability compared with FY2023-24.
Profit & Loss
₹ Crore
| Particular | FY24 | FY25 | Change |
|---|---|---|---|
| Revenue from Operations | 36.46 | 31.44 | -13.8% |
| Investment Income | 7.12 | 8.99 | +26.2% |
| Other Income | 0.06 | 0.19 | — |
| Total Income | 43.63 | 40.62 | -6.9% |
| Employee Expenses | 10.33 | 11.14 | +7.8% |
| Finance Costs | 0.20 | 0.26 | — |
| Depreciation & Amortisation | 4.90 | 3.34 | -31.9% |
| Other Expenses | 11.48 | 12.49 | +8.8% |
| Profit Before Tax | 16.73 | 13.38 | -20.0% |
| PAT | 14.93 | 10.67 | -28.5% |
FY25 figures are based on the company’s reported financial statements.
Revenue Analysis
The decline in operating revenue from ₹36.46 crore to ₹31.44 crore in FY25 is important.
However, HPX also earned approximately ₹8.99 crore of investment income, compared with ₹7.12 crore in FY24.
As a result, total income declined less sharply, from ₹43.63 crore to ₹40.62 crore.
This means investors should distinguish between:
Operating revenue generated from the exchange
and
Investment income generated from the company’s large cash/investment balances.
This distinction is particularly important when assessing the sustainable earnings power of HPX.
Profitability
PAT declined from approximately ₹14.93 crore in FY24 to ₹10.67 crore in FY25.
The company nevertheless remained profitable.
The FY25 net profit margin based on total income was approximately 26.3%, compared with approximately 34.2% in FY24.
The decline reflects lower operating revenue combined with higher employee and administrative expenses.
Balance Sheet
₹ Crore
| Particular | FY24 | FY25 |
|---|---|---|
| Total Assets | 315.47 | 365.64 |
| Equity Share Capital | 55.25 | 55.25 |
| Other Equity | 1.32 | 11.996 |
| Cash & Cash Equivalents | 215.85 | 234.32 |
| Other Bank Balances | 71.11 | 79.52 |
| Trade Receivables | 1.50 | 1.85 |
HPX had approximately ₹234 crore of cash and cash equivalents and another ₹79.5 crore of bank balances at March 31, 2025.
This provides the company with a substantial liquidity buffer relative to its operating scale.
Net Worth
FY25 equity consists of:
- Equity share capital: approximately ₹55.25 crore
- Other equity: approximately ₹12.00 crore
This gives total reported equity of approximately ₹67.25 crore.
The significant increase in retained earnings reflects the company’s move into profitability.
Cash Flow
HPX generated approximately ₹18.49 crore of operating cash flow in FY25, compared with an unusually high ₹173.09 crore in FY24.
The FY24 figure benefited substantially from working-capital movements and should therefore not be treated as a normalised annual cash-flow level.
FY25 operating cash flow was nevertheless positive and exceeded reported PAT.
The company had relatively limited financing activity, with financing cash flow primarily reflecting lease-related payments.
Trading Volume
Trading volume is arguably the most important operating metric for HPX.
During FY2024-25, the three Indian power exchanges together transacted approximately 143.68 billion units (143,677 MU).
HPX accounted for approximately 8.77 billion units, compared with approximately:
- IEX: 120.64 BU
- PXIL: 14.27 BU
- HPX: 8.77 BU
HPX therefore accounted for approximately 6.1% of total power-exchange volume on this delivery-date basis during FY2024-25.
This is an important change from the much higher market-share levels HPX achieved in selected segments such as TAM.
Segment Strength – Term-Ahead Market
HPX’s strongest competitive position has historically been in the Term-Ahead Market.
During FY2023-24, HPX reported more than 9 BU of TAM trading volume and approximately 28% market share in that segment.
An industry presentation in July 2025 also reported that HPX had approximately 10 BU of traded volume in FY25 and more than 25% share in TAM, highlighting the company’s relative strength in this segment.
This is important because HPX does not need to dominate every electricity-market segment to build a viable exchange business; building strong positions in selected products can provide a path toward greater overall liquidity.
Day-Ahead Market Position
HPX’s position in DAM remains considerably smaller.
According to the FY2024-25 market monitoring data, total DAM volume across the three exchanges was approximately 61.29 BU.
HPX’s DAM volume was only approximately 0.71 million units (0.71 MU) during FY2024-25, compared with more than 61 billion units at IEX.
Therefore, HPX’s current business should not be analysed as an IEX-style DAM-dominated platform.
Its competitive position has instead been more visible in TAM, long-duration contracts and selected specialised market products.
Power Exchange Industry in India
India currently has three major power exchanges:
- Indian Energy Exchange – IEX
- Power Exchange India Limited – PXIL
- Hindustan Power Exchange – HPX
The Ministry of Power confirms that HPX is the third exchange and began operations in July 2022.
During FY2024-25, electricity traded through power exchanges reached approximately 143.68 BU.
This represented approximately 8.49% of India’s total electrical energy supplied during the year.
The broader power market therefore provides substantial room for exchange-based transactions to expand over time.
Market Growth Drivers
1. Increasing Power Demand
India’s electricity consumption is expected to continue increasing with:
- Industrialisation
- Urbanisation
- Data centres
- Electric vehicles
- Manufacturing
- Cooling demand
- Digital infrastructure
Higher and more variable electricity demand can increase the importance of short-term electricity markets.
2. Renewable Energy Integration
Solar and wind generation are inherently variable.
Power exchanges provide a mechanism for generators, distribution companies and large consumers to manage deviations and optimise procurement.
This creates opportunities for:
- GDAM
- GTAM
- RTM
- Green contracts
- Longer-duration renewable contracts
3. Growth of Real-Time Trading
As renewable generation increases, real-time balancing becomes more important.
This creates potential growth opportunities in RTM and other short-duration products.
4. Long-Duration Contracts
HPX has developed products extending beyond conventional short-term electricity transactions.
Its strength in TAM and long-duration contracts provides a differentiated route for gaining market share.
5. Market Coupling
Market coupling is one of the most important regulatory developments for the Indian power-exchange industry.
Under market coupling, bids from multiple exchanges can be combined for price discovery through a central mechanism.
The policy is intended to improve efficiency and price discovery across the electricity market.
HPX has publicly positioned itself as a potential beneficiary of greater liquidity and more centralised price discovery, while the actual impact on individual exchanges will depend on implementation details and participant behaviour.
In July 2025, CERC’s market-coupling decision attracted significant attention because it could alter the competitive dynamics among the exchanges.
Regulatory Considerations
Power exchanges operate under extensive CERC regulation.
One important issue involves ownership restrictions and conflicts between exchange shareholders and market participants.
A 2026 CERC proceeding concerning HPX involved PTC India’s request for additional time to dilute its shareholding if it became a trading member.
The regulatory proceedings noted that PTC continued to hold 22.62% of HPX as of September 30, 2025.
This illustrates an important feature of HPX: its growth is closely linked to both market economics and regulatory rules governing power exchanges.
Competitive Landscape
Indian Energy Exchange
IEX is India’s largest power exchange and has historically dominated several major market segments.
Its much larger trading volume provides substantial liquidity and network effects.
Power Exchange India Limited
PXIL is the second established exchange and competes with HPX across several electricity-market products.
Hindustan Power Exchange
HPX is the youngest of the three exchanges and has attempted to differentiate itself through:
- Term-Ahead Market
- Long-duration contracts
- Specialised products
- Reverse auctions
- Technology
- Customer-focused market solutions
The competitive challenge is that power exchanges benefit strongly from liquidity and participant network effects.
Competitive Advantage
HPX’s potential advantages include:
Institutional Shareholders
PTC India, BSE Investments and ICICI Bank provide institutional credibility.
Established TAM Position
The company’s strong historical TAM market share provides evidence that it can build liquidity in selected products.
Technology Platform
The exchange operates an electronic trading platform designed to support multiple market products.
Large Cash Position
The company has a substantial liquidity position relative to its operating expenses.
Multiple Product Categories
HPX is not dependent on a single electricity-market product.
Key Risks
1. Dominant Position of IEX
IEX has a substantial network and liquidity advantage.
The biggest challenge for HPX is therefore attracting enough buyers and sellers to create deeper liquidity.
2. Market Share Volatility
Exchange revenues are linked to traded volumes.
A reduction in market share can have a direct effect on transaction revenue.
3. Regulatory Risk
Changes in:
- Market-coupling rules
- Trading-member restrictions
- Transaction-fee regulations
- Electricity-market design
- Market-product approvals
could affect HPX’s economics.
4. Transaction Fee Pressure
Power-exchange transaction fees are relatively small compared with the value of electricity traded.
Competition between exchanges can place pressure on fee structures.
5. Dependence on Trading Volumes
The company does not control the underlying electricity demand or supply.
Revenue therefore depends heavily on market participation and transaction volumes.
6. Concentration in TAM
HPX’s stronger position in TAM is positive from a diversification perspective only to the extent that it can translate into broader market participation.
7. Unlisted Liquidity
HPX shares are not traded on NSE or BSE.
Consequently:
- Price discovery is limited
- Bid/ask spreads can be wide
- Transaction sizes may be restricted
- Exit timing can be uncertain
- Indicative prices may differ substantially between intermediaries
Current Unlisted Share Price
Unlisted-market prices for HPX vary significantly between private-market platforms.
One platform reported approximately ₹23.42 per share on September 15, 2026, while another reported an indicative price of approximately ₹36.05 on September 10, 2026.
These prices should not be interpreted as exchange-traded market prices.
For valuation purposes, it is therefore more appropriate to use a range rather than treating one intermediary’s quote as an official market price.
Indicative Valuation
HPX has approximately 55.25 crore shares outstanding.
Using two recent indicative unlisted prices:
| Metric | At ₹23.42 | At ₹36.05 |
|---|---|---|
| Shares Outstanding | 55.25 Cr | 55.25 Cr |
| Implied Market Cap | ~₹1,294 Cr | ~₹1,991 Cr |
| FY25 PAT | ₹10.67 Cr | ₹10.67 Cr |
| FY25 EPS | ~₹0.19 | ~₹0.19 |
| Indicative P/E | ~12.1x | ~18.7x |
| FY25 Book Value | ~₹67.25 Cr | ~₹67.25 Cr |
| Indicative P/B | ~19.2x | ~29.6x |
Important: These calculations use reported FY25 standalone financials and the indicative private-market prices cited above. They are not a formal valuation.
The very high P/B multiple is largely a consequence of the company’s relatively low accounting equity compared with the value attributed to the exchange platform.
For HPX, P/E, EV/EBITDA, traded-volume economics and future market share are more informative than P/B alone.
Investment Income – Important Valuation Point
HPX held approximately ₹234 crore in cash and another ₹79.5 crore in other bank balances at March 31, 2025.
It generated approximately ₹8.99 crore of investment income in FY25.
This means a portion of reported earnings comes from its liquidity/investment portfolio rather than directly from exchange transaction activity.
A long-term valuation should therefore separate:
Core exchange earnings
from
Income earned on surplus cash and investments.
This gives a clearer picture of the sustainable economics of the platform.
FY25 Key Metrics
| Metric | FY25 |
|---|---|
| Revenue from Operations | ₹31.44 Cr |
| Investment Income | ₹8.99 Cr |
| Total Income | ₹40.62 Cr |
| PAT | ₹10.67 Cr |
| Operating Cash Flow | ₹18.49 Cr |
| Cash & Cash Equivalents | ₹234.32 Cr |
| Other Bank Balances | ₹79.52 Cr |
| Total Equity | ~₹67.25 Cr |
| Shares Outstanding | 55.25 Cr |
| Face Value | ₹1 |
| FY25 EPS | ~₹0.19 |
| FY25 ROE | ~16% |
Financial data is based on FY25 reported statements.
What Could Drive Future Value
HPX’s future valuation is likely to depend on five major variables:
1. Increase in traded volumes
Higher volumes can directly increase transaction-related revenue.
2. Expansion beyond TAM
Moving from a TAM-focused position toward greater participation in DAM, RTM, GDAM and other products could diversify revenue.
3. Market coupling
The implementation structure and its effect on liquidity and price discovery could materially alter competitive dynamics.
4. Growth in India’s power market
Greater electricity consumption and renewable penetration should increase the need for market-based power procurement and balancing.
5. Operating leverage
Once an exchange reaches sufficient scale, incremental transaction volume can potentially be processed without proportional increases in fixed operating costs.
This creates the possibility of operating leverage if HPX materially increases its traded volumes.
Key Metrics Investors Should Track
For an unlisted HPX investment, the following indicators are particularly important:
- Total traded volume
- TAM market share
- DAM market share
- RTM market share
- Transaction revenue
- Revenue per traded unit
- Number of active members
- Number of active participants
- Operating margin
- PAT
- Operating cash flow
- Cash and investments
- Market-coupling developments
- Regulatory changes
- Potential IPO/DRHP developments
Corporate Information
Company: Hindustan Power Exchange Limited
Former Name: Pranurja Solutions Limited
CIN: U74999MH2018PLC308448
Incorporated: 2018
Operations Commenced: July 6, 2022
Registered Office: 25th Floor, P. J. Towers, Dalal Street, Fort, Mumbai – 400001
Corporate Office: World Trade Tower, Sector 16, Noida – 201301
Face Value: ₹1
Shares Outstanding: 55.25 Cr
Status: Unlisted Public Company
Important Links
Official Website:
Hindustan Power Exchange – HPX
Annual Reports & Returns:
HPX Annual Reports / Annual Returns
FY2023-24 Annual Report:
HPX FY2023-24 Annual Report
Ministry of Power – Annual Report 2024-25:
Ministry of Power Annual Report 2024-25
CERC:
Central Electricity Regulatory Commission
Conclusion
Hindustan Power Exchange represents a relatively young entrant into India’s electricity-exchange industry.
The company has already achieved profitability after initially operating at a loss, with FY24 marking a significant turnaround. FY25 remained profitable, although revenue and PAT declined from FY24 levels.
The most important aspect of the HPX story is volume growth.
The company has established a meaningful position in the Term-Ahead Market and has developed additional products such as long-duration contracts and specialised electricity-market solutions.
However, HPX faces a substantial competitive challenge from the established market leader, particularly because electricity exchanges benefit from liquidity and network effects.
The potential impact of market coupling is therefore particularly important for HPX because changes in the price-discovery mechanism could alter how participants distribute volumes across exchanges.
From a financial perspective, HPX has a strong liquidity position relative to its operating scale. Its approximately ₹234 crore cash balance and ₹79.5 crore of additional bank balances provide a significant financial cushion.
At the same time, investors should not value the company solely on its current PAT. A proper assessment should consider:
traded volumes → market share → transaction revenue → operating leverage → sustainable earnings → cash balance → regulatory structure → potential IPO/listing.
Disclaimer
This report is prepared for informational and research purposes only and does not constitute investment advice.
Hindustan Power Exchange Limited is an unlisted company. Prices quoted in the private market are indicative and may vary materially between intermediaries and transactions. They are not equivalent to NSE/BSE market prices.
Financial information has been compiled primarily from HPX’s publicly available filings and annual reports, supplemented by regulatory and industry sources.
The current unlisted share prices used in this report are indicative secondary-market references and should be independently verified before any transaction.
Investors should independently verify the latest financial statements, shareholding pattern, valuation, taxation, transfer restrictions, liquidity, regulatory developments and any proposed IPO/DRHP before making an investment decision.
The author of this report is not a SEBI-registered Research Analyst unless separately stated.